


VMware vSphere CPU topology effects on VDI performance: NUMA vNUMA and CPU scheduling


It’s been more than 10 years since we started to virtualize RDSH-based workloads and over the years the most discussed topic is how to size the RDSH VMs. In an RDSH environment, the CPU will most likely be your first bottleneck. To get the highest user density (which is the reason to use RDSH instead of VDI in the first place) you need to know what the best CPU configuration is for your RDSH-based VMs. “Best practices” differ from 4 vCPU VMs to 8 vCPU VMs or half the size of a NUMA node. And then you must decide how many VMs per host and what the total amount of vCPUs you’ll use. And should you overcommit on CPU and if so, how much? This research will focus on the performance impact of the different sizing options of RDSH VMs.
The most commonly used products in the RDSH-space are Citrix Virtual Apps (AKA XenApp) and VMware Horizon Apps. What are these vendors recommending when it comes to sizing the RDSH VMs?
The latest recommendation from Citrix professional services which I could find is documented here: https://www.citrix.com/blogs/2017/11/22/xenapp-scalability-v2017/
One advice I would like to quote:
For the 2680 (14 cores per socket), I’d recommend 7 vCPUs for each XenApp VM with 8 VMs on each host. And for the 2697A (16 cores per socket), I’d go with 8 vCPUs with 8 VMs on each host.
It’s an interesting recommendation as our tests are performed on an Intel E5-2680 v4 CPU.
In the Architecture planning guide, the suggested configuration of the RDSH VM is 4 vCPUs: https://docs.vmware.com/en/VMware-Horizon-7/7.7/horizon-architecture-planning/GUID-C653B8FB-BCB5-4E33-BA0B-44B5FCAA2762.html
In the VMware Horizon sizing limits and recommendations knowledgebase article, the recommendation for the number of CPUs is 8-64 vCPUs: https://kb.vmware.com/s/article/2150348
So, VMware doesn’t give a straight answer, which could be a good thing because the sizing may depend on the type of applications, type of CPU or other variables.
Getting the most users on a server isn’t the only thing to consider when it comes to sizing RDSH VMs. In some situations, you might want (or need) to minimize the number of Windows licenses, so you want to host fewer VMs per host which are larger sized. In other situations, it makes more sense to create a lot of smaller sized RDSH VMs. Maybe because of some rogue application the number of users per VM needs to be limited. This research focusses on getting the most users on a host however.
By default, Spectre and Meltdown mitigations are not enabled on Windows server 2016 (even though the patches are installed). As the investigation about the impact of enabling those mitigations is an interesting topic by itself, we decided to not enable it during these tests. The L1TF mitigation on ESXi (by enabling the ESXi Side-Channel-Aware Scheduler) was also not performed. These settings will be tested in an upcoming research.
The tests for this research were performed on a Nutanix-lab environment. The node on which the tests were performed is part of a 4-node cluster. Usually, a controller VM (CVM) is present on each Nutanix node, but for these tests this CVM was powered off. The storage of the other nodes in the cluster was accessed by the test-node over NFS. The node is a dual socket CPU and is an Intel E5-2680 v4 @ 2.40GHz processor. This CPU is based on a Broadwell architecture, containing 14 cores. That means a total of 28 physical CPU cores are present and with Hyperthreading enabled 56 logical CPU cores are available. VMware ESXi 6.7U1 was used during these tests. You can read more about this Nutanix-lab infrastructure here.
The Login VSI workload knowledgeworker is modified as described here and used during these tests. The Remote Desktop Analyzer (RDA) data capture was disabled due to the overhead of RDA on RDSH and the PDF-printer was not disabled. SBC timer was not enabled.
All configurations used the same Windows server 2016 image with 32-bit Office 2016 and the Citrix Optimizer optimizations. The amount of memory for each configuration was adjusted to accommodate at least 1 GB of RAM per user.
The Login VSI VSImax results represent the overall capacity between the scenarios. The VSImax is the defacto industry standard metric and is calculated score to detriment the saturation point of the virtual desktop environment. More information about the VSImax is explained here. The following graph shows an overview of the results of all configured tests:
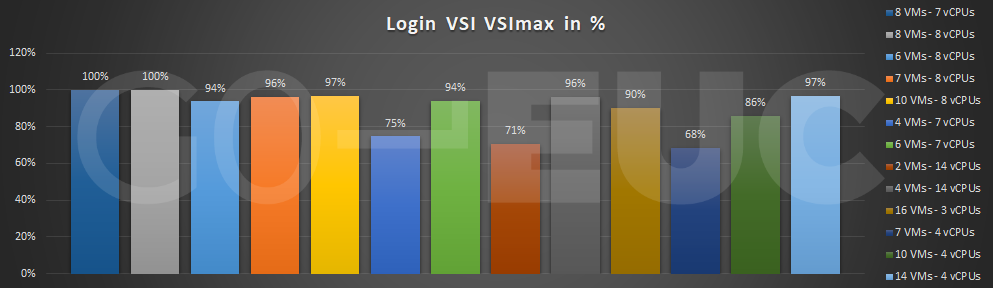
Higher is better
VSImax shows that on this specific hardware with the LoginVSI workload 8 VMs with 7 or 8 vCPUs provide the most optimal scenario from a capacity perspective. It’s quite interesting that there’s no difference between these 2 configurations. With 8 VMs and 7 vCPUs per VM all the hyperthreaded cores are used (2x 14 cores x hyperthreading = 56 logical cores). With 8 VMs and 8 vCPUs we are overcommitting on logical CPUs (64 vCPUs on 56 logical cores), which is not recommended for RDSH workloads.
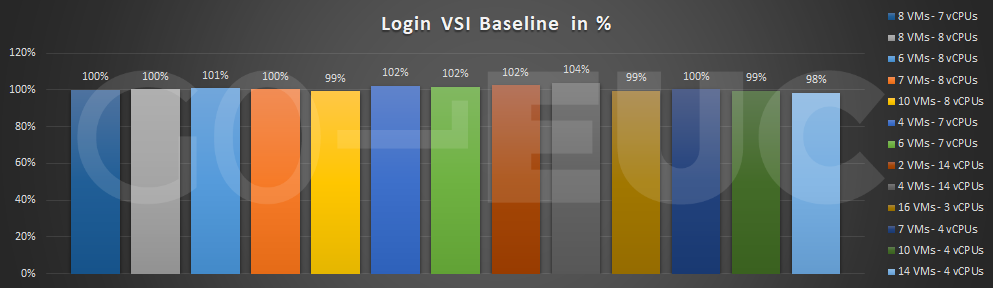
It is important to validate if the VSImax score is reflected in the Login VSI baseline.
Lower is better
The Login VSI baseline shows a minimal difference between the scenarios, which means the response times are similar.
To get a better understanding between the different scenarios, we decided to show only the best performing configurations, the least performing configuration, a configuration with a few large VMs and a configuration with many small VMs:
The following chart shows the difference in VSImax and Login VSI baseline of these 5 scenarios:
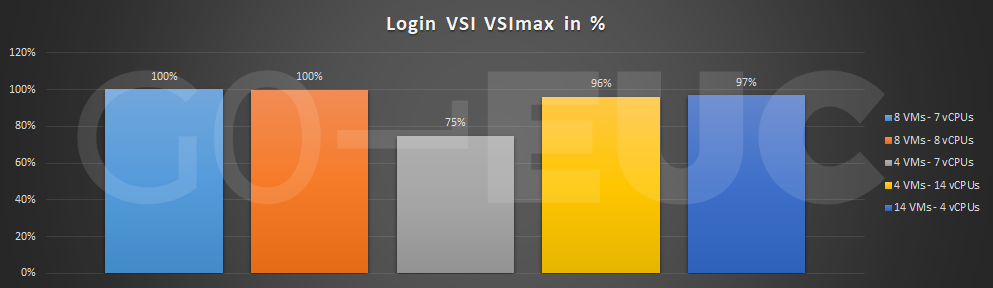
Higher is better
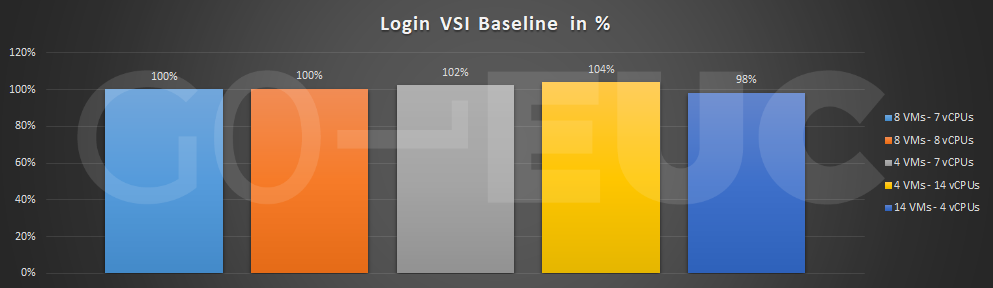
Lower is better
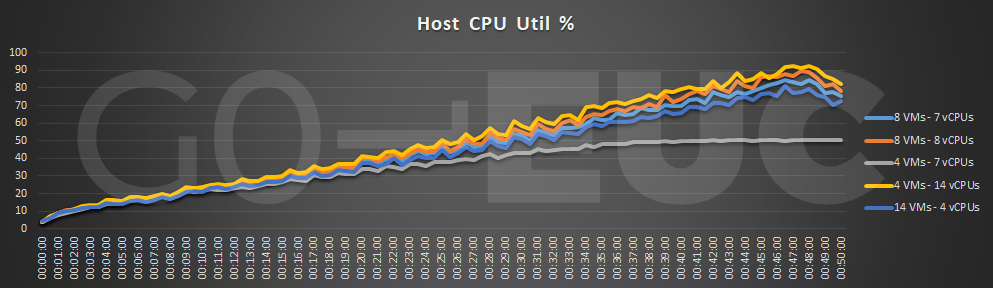
Within the Nutanix lab the saturation point is CPU related, so according to the VSImax there should be a difference in CPU load between the scenarios.
Lower is better
Using the 2 VMs with 14 vCPUs or 4 VMs with 7 vCPUs configurations consumes only 28 vCPUs in total. In the CPU util% graph, it is shown that the CPU in the host is underutilized in these configurations. The difference between the other scenarios when it comes to CPU utilization is closer, but there is still a difference of 10-15% between the “4 VMs – 14 vCPUs” and the “14 VMs – 4 vCPUs”.
The CPU load between the scenarios corresponds with the VSImax results.
Lower is better
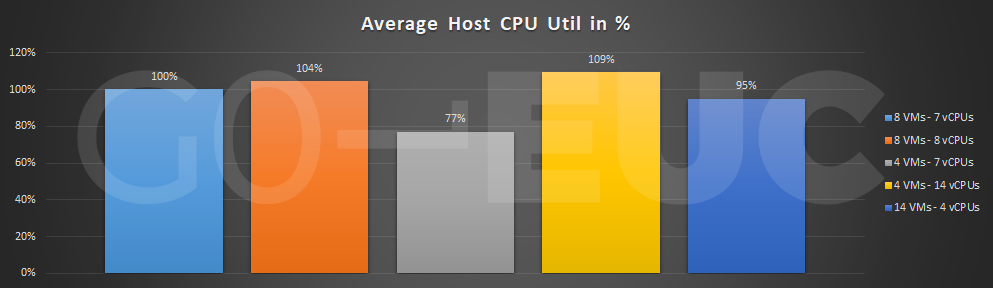
Knowing that the “8 VMs – 7 vCPUs” and the “8 VMs – 8 vCPUs” will result in comparable VSImax scores, based on the average CPU utilization, the “8 VMs – 7 vCPUs” scenario is slightly more preferable because of the lower CPU utilization.
Lower is better
Lower is better
Lower is better
Lower is better
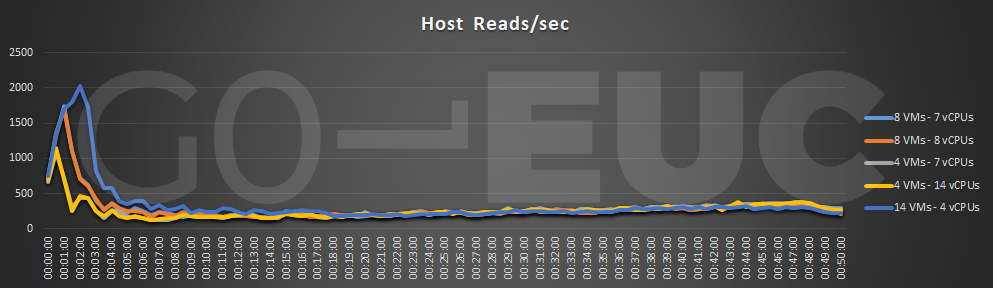
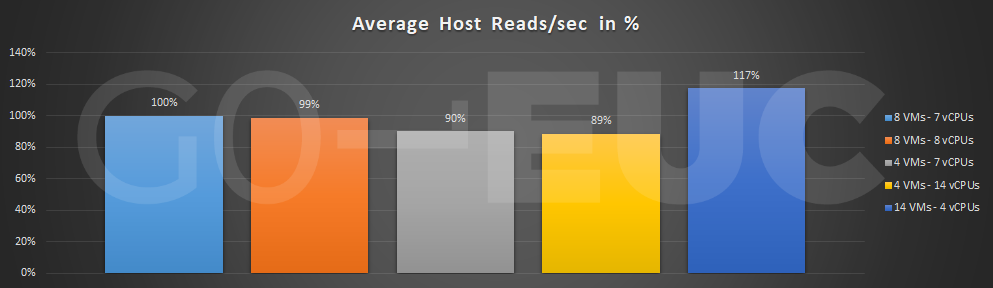
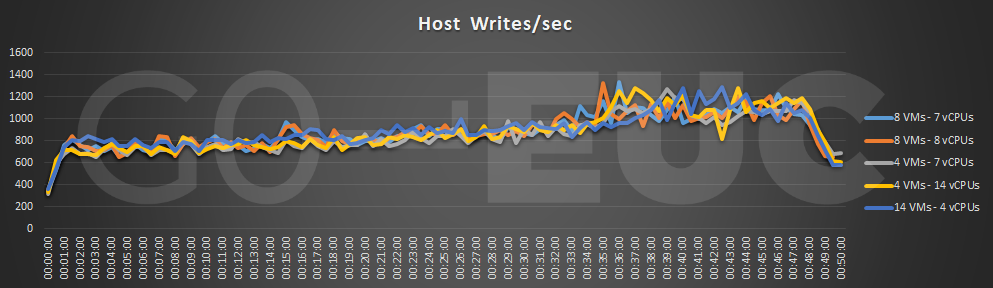
The storage-related charts show little difference between the scenarios. In the graph, you will notice that the configurations with more VMs will use more read IO at the start of the test. This is because on every VM, the first user will read from storage at login in and starting applications. The next user on the same VM will take advantage of the fact that applications are already started and stored in the cache.
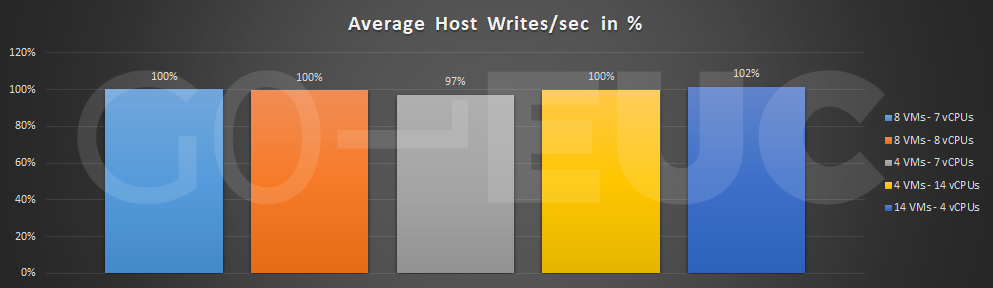
On average, the Write IO pattern is similar. The configuration with 14 VMs has a slightly higher value of writes/sec, which is explainable because of the Windows Operating System overhead of the 14 VMs.
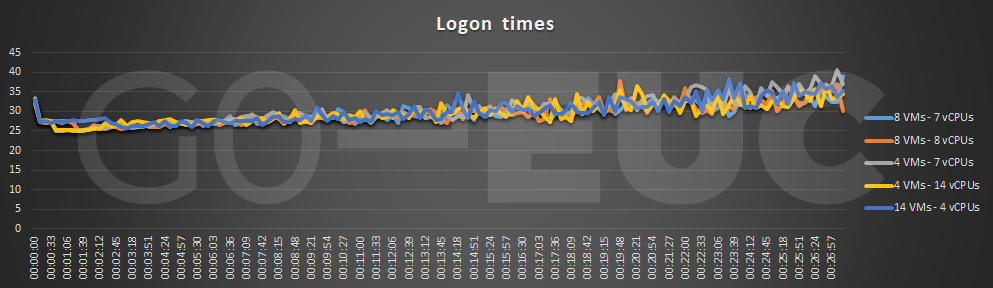
The following chart shows the logon time of the first 150 users during each scenario. Only first 150 logons were used to calculate the average logon time, because with one of the test configurations, the VSImax was already reached at that point and that wouldn’t give a fair comparison:
Lower is better
Lower is better
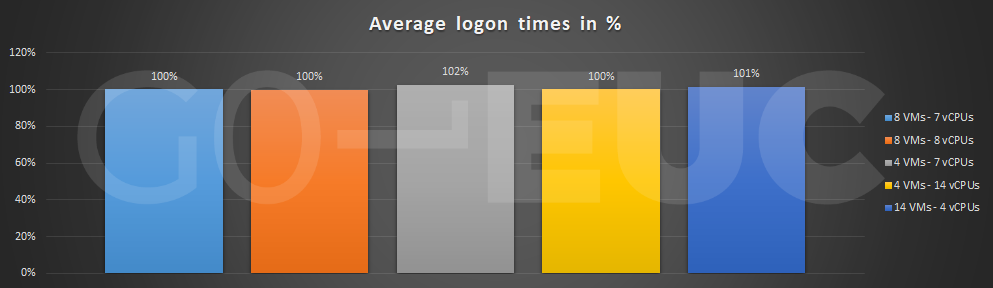
There are not a lot of differences in logon times between the different configurations.
To get the highest user density with an RDSH configuration you must find the sweet spot of the right number of VMs with the right number of vCPUs assigned to them. For the Login VSI workload used at GO-EUC and on the type of hardware we performed these tests, a configuration with 8 VMs and 7 or 8 vCPUs will give the highest user density. The 7 vCPU configuration is slightly more preferable in this situation, because of the lower CPU utilization of the host. With other hardware specifications, the advice is to start with half the number of cores of the physical CPU per VM with a maximum of 8 vCPUs per VM. The total number of vCPUs should be equal to the total of number of hyperthreaded cores. This is a good starting point. Testing different configurations with a tool like Login VSI is advisable if you want to be sure that you use the best configuration in your situation.
As expected, Read and Write IO are not a bottleneck with the Login VSI workload on RDSH. There are also very few differences between the tested configurations.
In an upcoming research, we will focus on the impact of Spectre, Meltdown and Foreshadow on Windows server 2016 and 2019 RDSH.
If you have comments about this research or want to discuss other configurations, please join us on the World of EUC Slack channel.
Photo by Laura Ockel on Unsplash

Echteld, Netherlands

Malta