


Performance impact of Citrix CVAD 2003


The last couple of years we’ve seen a steady increase in the GPU usage in VDI environments. With the changing landscape of GPU enabled applications, adding a GPU to a VDI environment is almost mandatory in order to deliver a great user experience. Often the connecting device is forgotten while building these GPU enabled VDI environments. In this research the focus is shifted from the VDI to the connecting device and show the importance of the device for the user experience.
There are three major competitors in the VDI GPU market:
Currently NVIDIA is dominating the market share when it comes to GPU’s in VDI environments. Microsoft recently introduced new GPU enabled desktops using AMD GPU’s. At this point Intel is a niche player in the market.
Application landscape is changing nowadays. Previously, GPUs reigned supreme in VDI’s environments where there was a very clear need of 3D acceleration, like AutoCAD. Nowadays more applications can leverage the usage of a GPU. Applications like Microsoft Office can take full advantage of the GPU and even Windows 10 itself can hugely benefit from a GPU.
In a recent poll on Twitter we asked people the most important factor to consider dealing with DaaS and VDI.
The result showed that performance was considered the most important with almost half of the votes.
In our own experience we see that a considerable amount of VDI projects fail because the end user experience is not in scope and is therefore often below par. Even though there is a huge focus on performance, this is often only done on a limited scope. This includes scalability on the hypervisor, tuning Windows on the VDI level and partially user experience by tuning the remoting protocol.
This research shifts the focus from the VDI to the connecting device. Whereas the VDI environment is life cycled every three years or so, the thin client for example has a much longer lifespan. This longevity which was always the main selling point of these devices is now turning into its own Achilles heel.
The setup and configuration for this research is a bit different from the usual GO-EUC setup.
In order to rule out any influence of the VDI on the performance and end user experience, it is important that the VDI was not a bottleneck in any way. For that reason, a NV-series VM running in Azure for the VDI is used.
As in the previous research, a hybrid-cloud configuration is used. This is realized using a site-to-site VPN which allows using both on-premises as cloud resources. Besides the Gateway VPN, a single Standard_NV6 VM is hosted in Azure. All other required infrastructure components, like Active Directory, DNS, and DHCP and file servers are hosted on-premises. The on-premises infrastructure is described here.
The Standard_NV6 has the following specifications:
| vCPU | 6 |
| Memory | 56GB |
| GPU | 1 Nvidia Tesla M60 |
| GPU memory | 8GB |
More information on the NV6 machines can be found here.
Windows 10 Enterprise 1909 is used as the default operating system using the Azure Marketplace. All required applications including, Microsoft Office 2016 x64 are installed using a post-OS installation task sequence in MDT. All Windows and Office updates are installed and Windows is optimized using Citrix Optimizer with the 1903 template. The brokering is provided by Citrix Virtual Apps & Desktops version 1909 with the 1912 LTSR VDA version installed on the VDI. The lasted NVIDIA Grid drivers are installed (version 441.66)
The following Citrix Graphics policies are set to ensure the best user experience:
| Policy | Default value | Set value |
|---|---|---|
| Use video codec for compression | Use video codec when preferred | For actively changing regions |
| Visual Quality | Medium | Build to lossless |
| Target framerate | 30 | 60FPS |
More info on the visual quality can be found here.
From Citrix XenDesktop 7.18 and onwards, build lossless uses H.264 or H.265 instead of JPEG. Content is initially displayed at a lower quality to improve session interactiveness.
The video codec is set to “For actively changing regions”. The end users benefit from lower bandwidth and better quality for video content combined with lossless text or high-quality images elsewhere. Please note that the target framerate is set to the maximum supported value of 60FPS and only focusing on H.264.
A custom PowerShell based workload is used for this research. This workload is divided in four sections to simulate different types of behaviors. The following activities are included:
The GPU intensity increases after each section of the workload, where the 60FPS Video is the highest consumed GPU section.
Thanks to the ThinClientSpecialist and Igel that provided the following thin clients:
A complete overview with all the specifications can be found here:
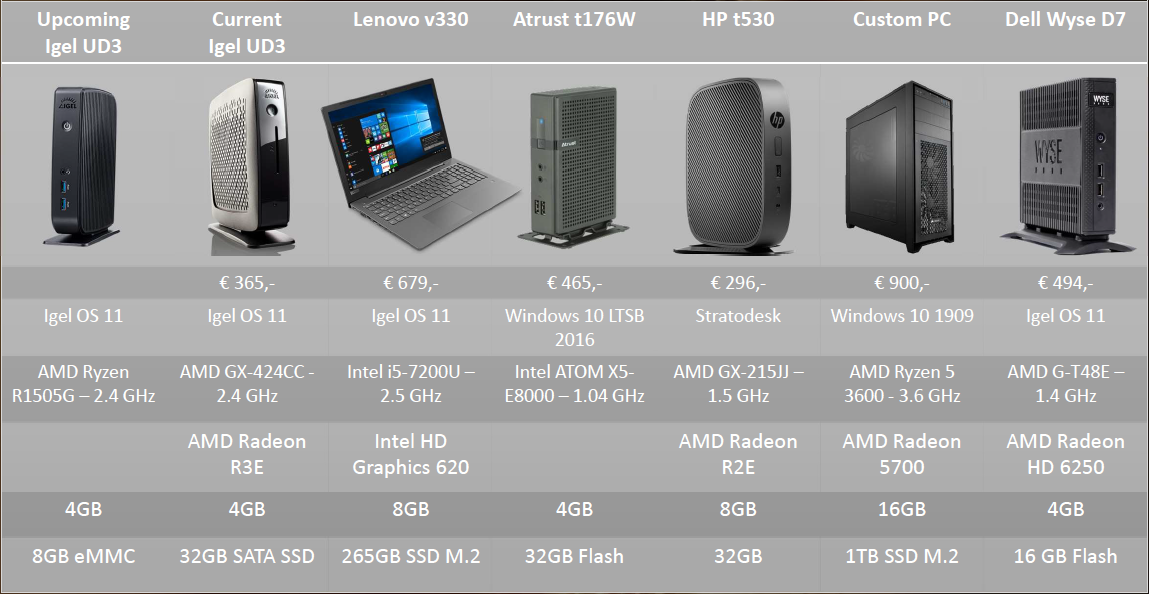
It is expected to see a minimal to no difference in the first two sections of the workload. These sections are office oriented and low on frame updates and therefore even the older endpoint should be able to keep up. With the last two sections it is expected to see a big difference between various endpoints, as this contains GPU enabled applications.
As this scenario is focused on single user experience there are no scalability results. All results are divided in the workload sections explained above.
In the video there is no visible difference between the various devices. This is as expected as there are minimal frame updates and therefore GPU usage.
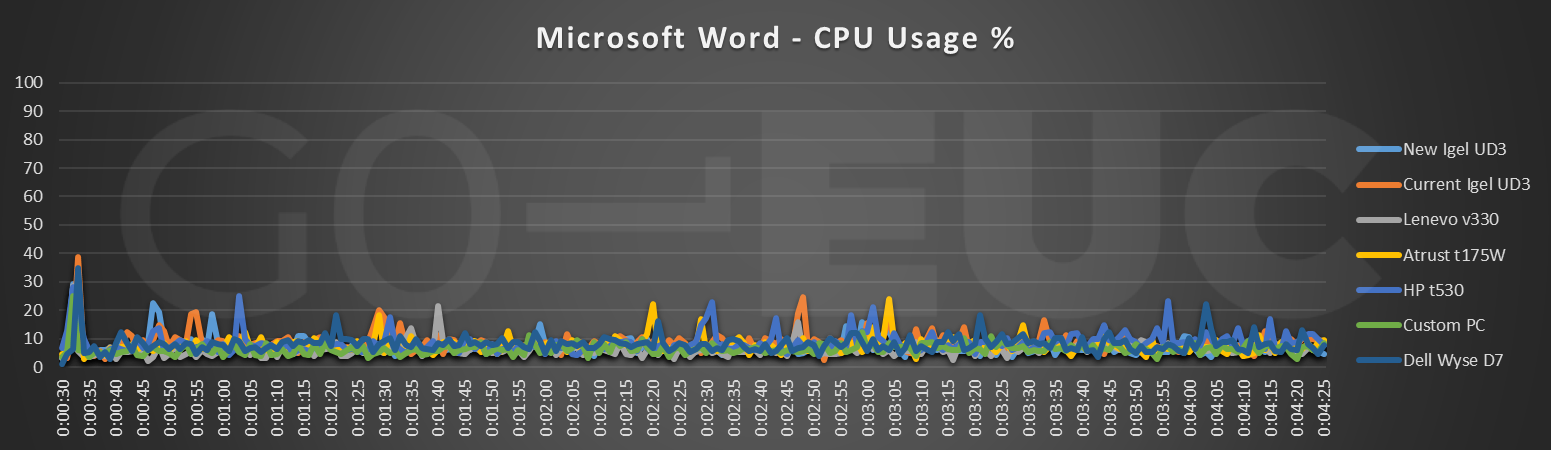
Lower is better
Lower is better
Lower is better
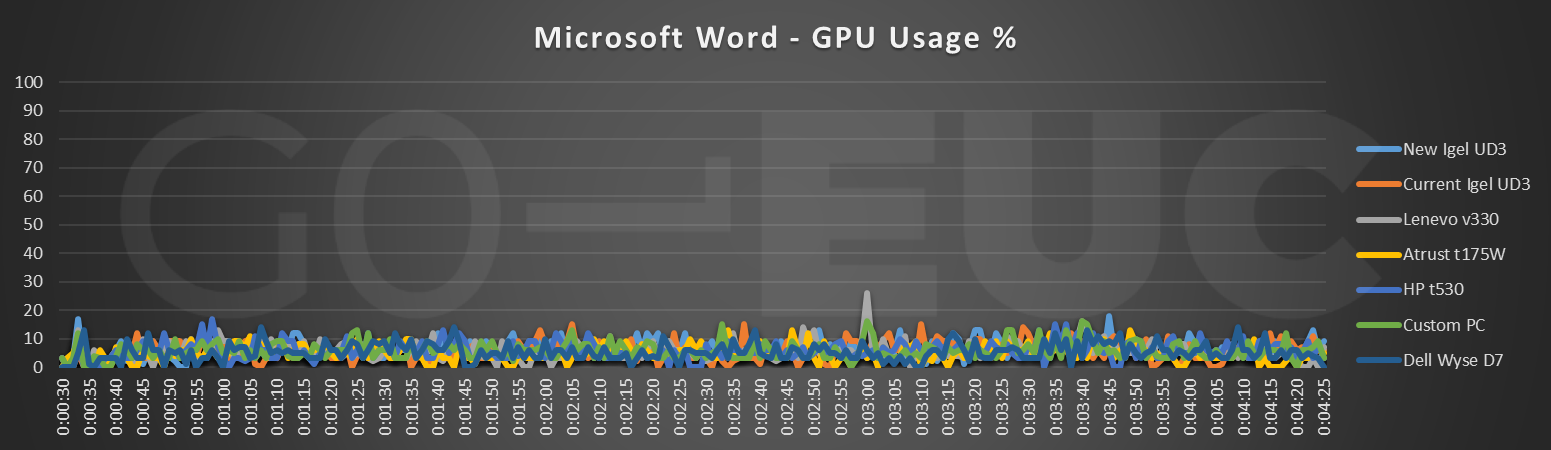
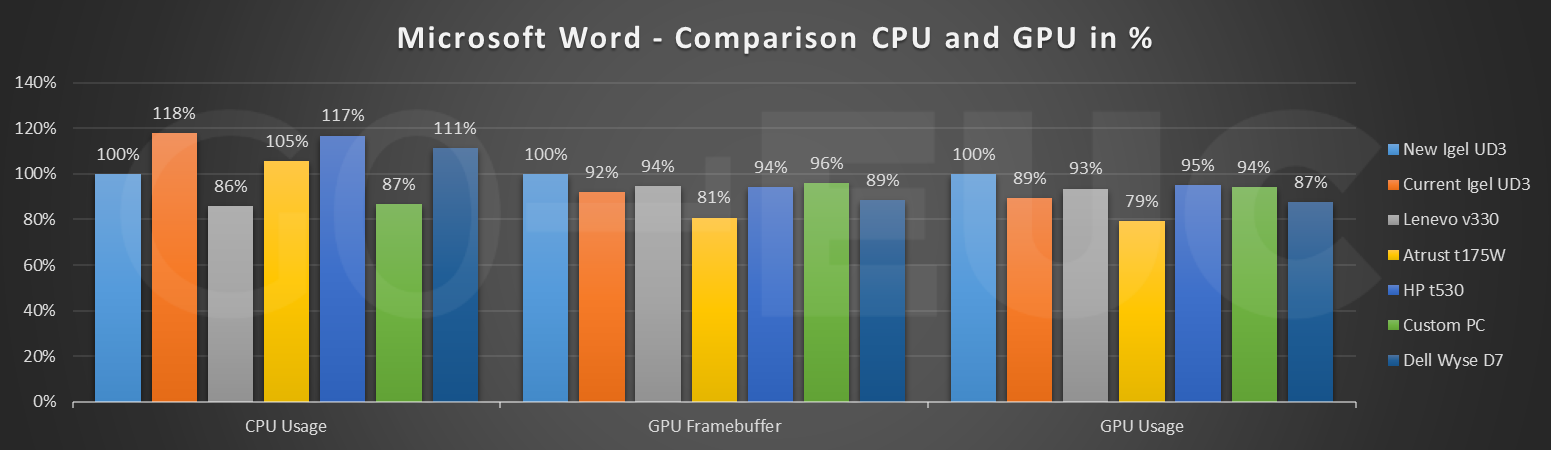
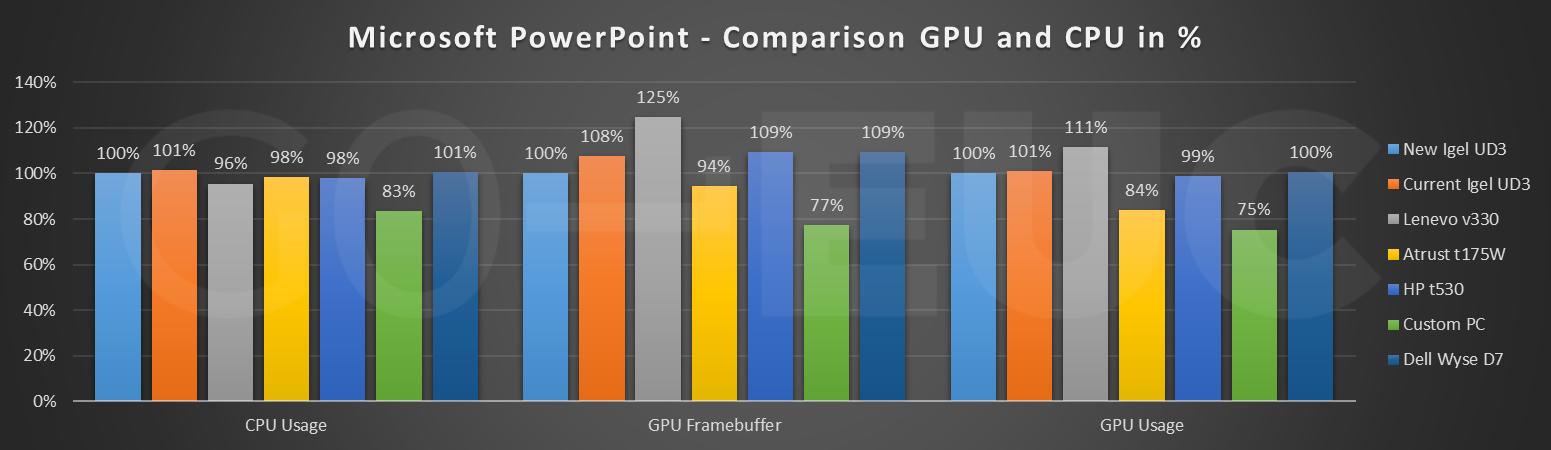
As expected, there is a minimal to no difference in the usage between the various devices. The GPU’s framebuffer is a portion of random-access memory (RAM) containing a bitmap that drives a video display. For more information please read the following article.
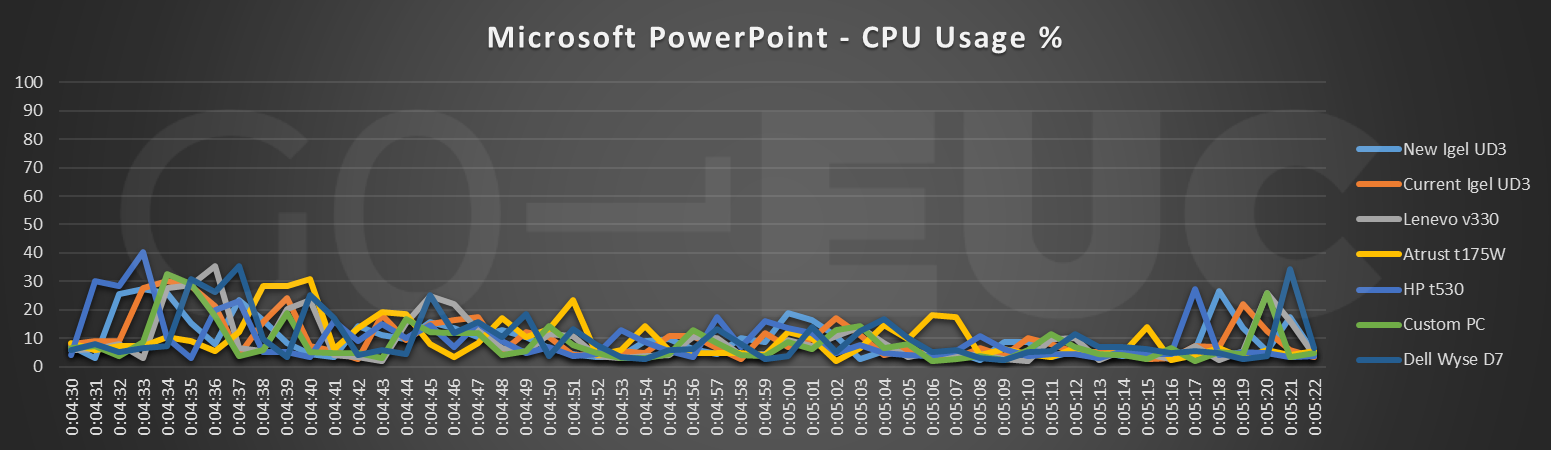
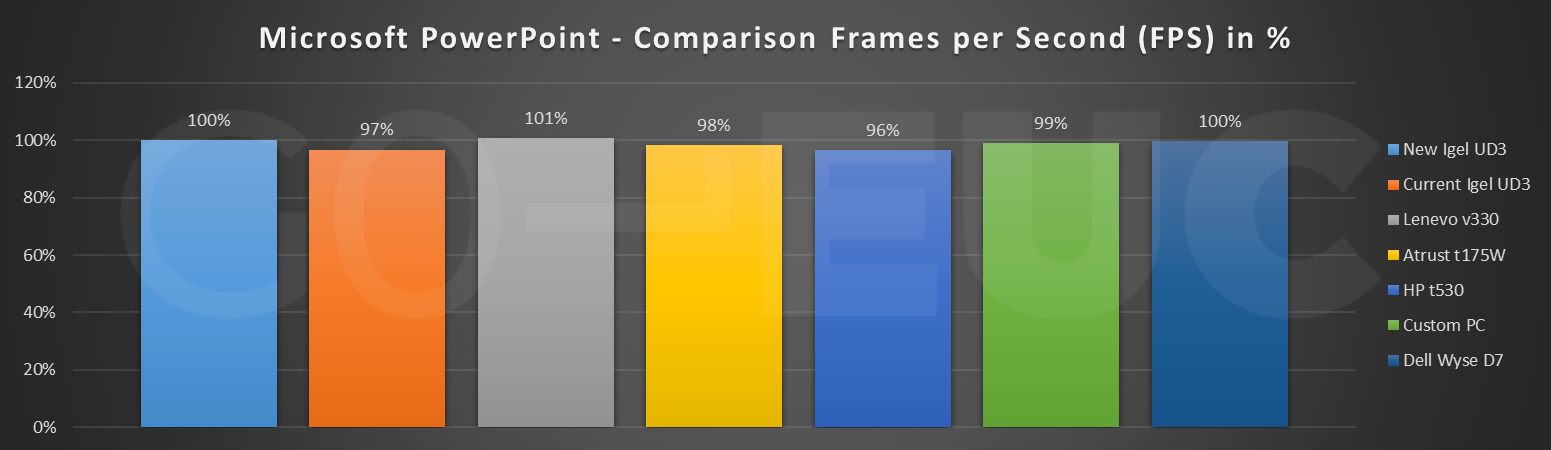
There are slide transitions in the PowerPoint section, so it is expected to see a minimal difference between the various devices.
Although not as expected, there is a clear difference in user experience. Especially the Dell Wyse D7 as this device is struggling to keep up with the animation.
Lower is better
Lower is better
Lower is better
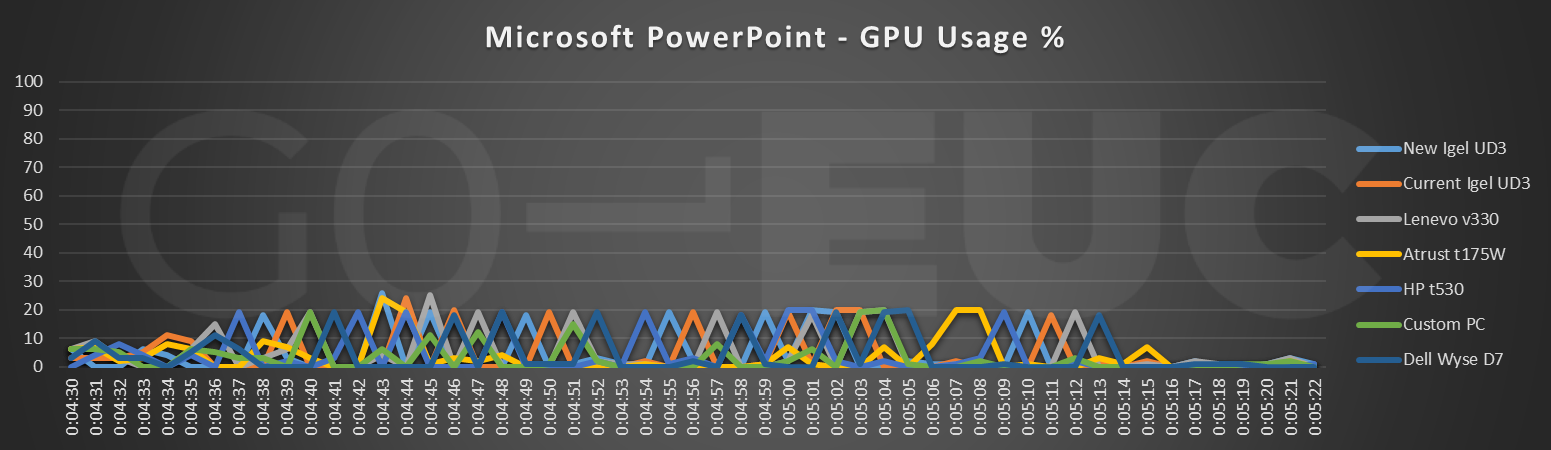
The data still shows a minimal difference even for the Dell Wyse D7. As there is a clear difference in the frames this should be noticeable in the data.
Lower is better
Lower is better
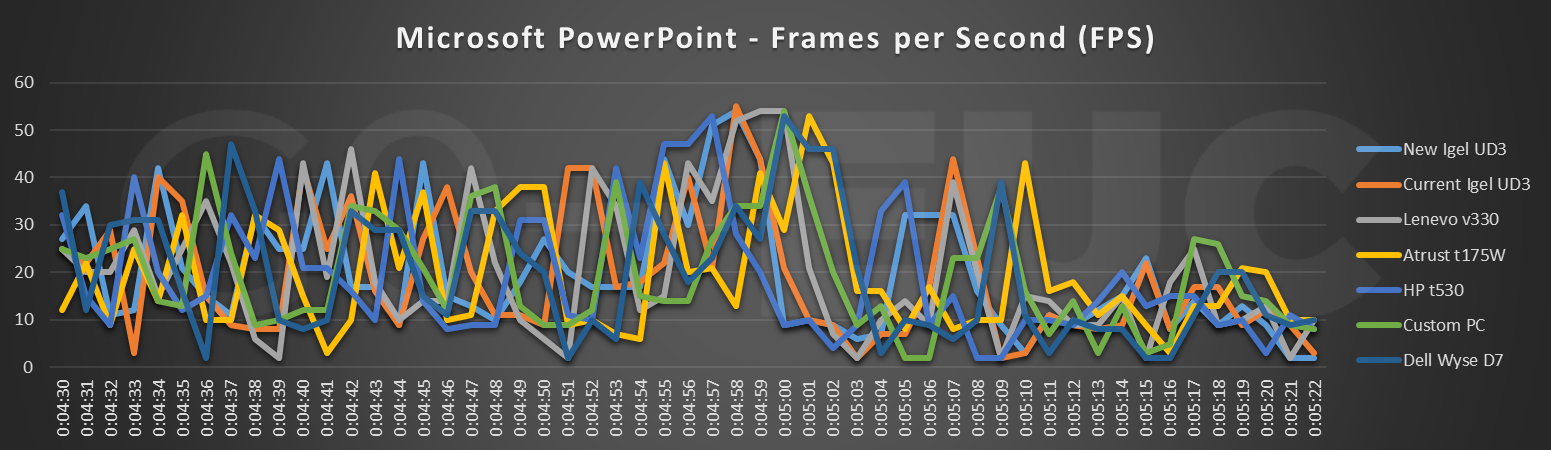
The outcome of the results are far from expected. The metrics shows no difference between the endpoints, while the experience in the video tells a different story.
All the frames are still being send to the client, but the endpoint is clearly struggling in the processing of the framerate.
This shows that the FPS is only a synthetic metric, and is, as such, not always the most reliable metric to measure the perceived user experience.
It is recommended to always validate the data based on ‘real’ output, by viewing the workload on the endpoint in real time or record the experience from and endpoints perspective with a video capture card.
In order to get a better overview in the difference in experience, the client devices are reduced to four devices for the next two sections. In this case the best devices and worst performing devices are selected.
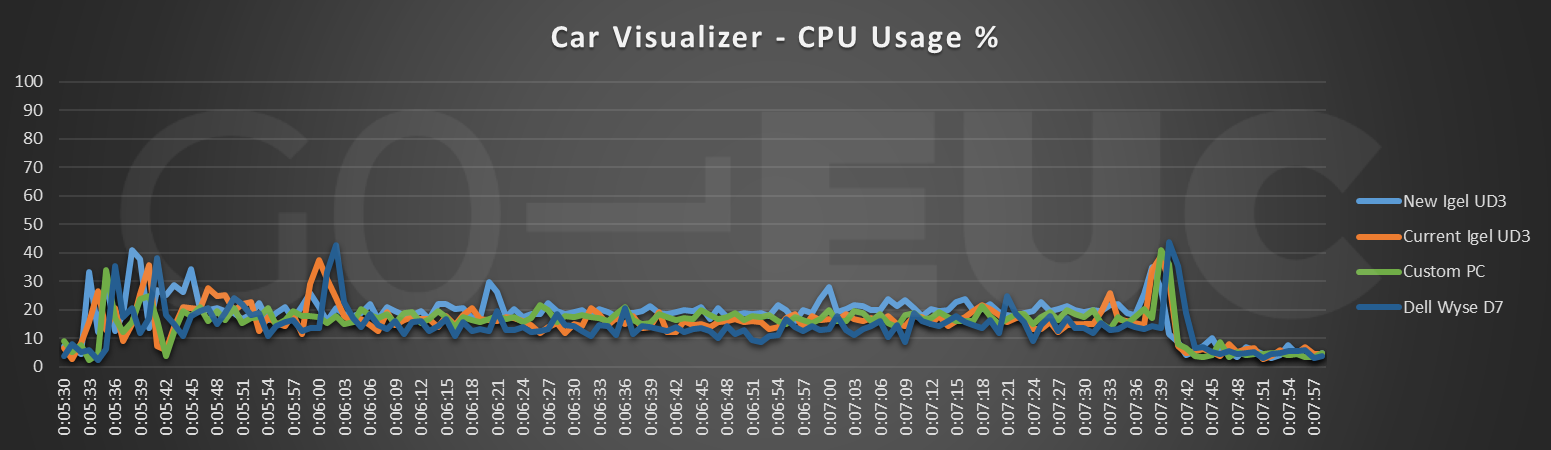
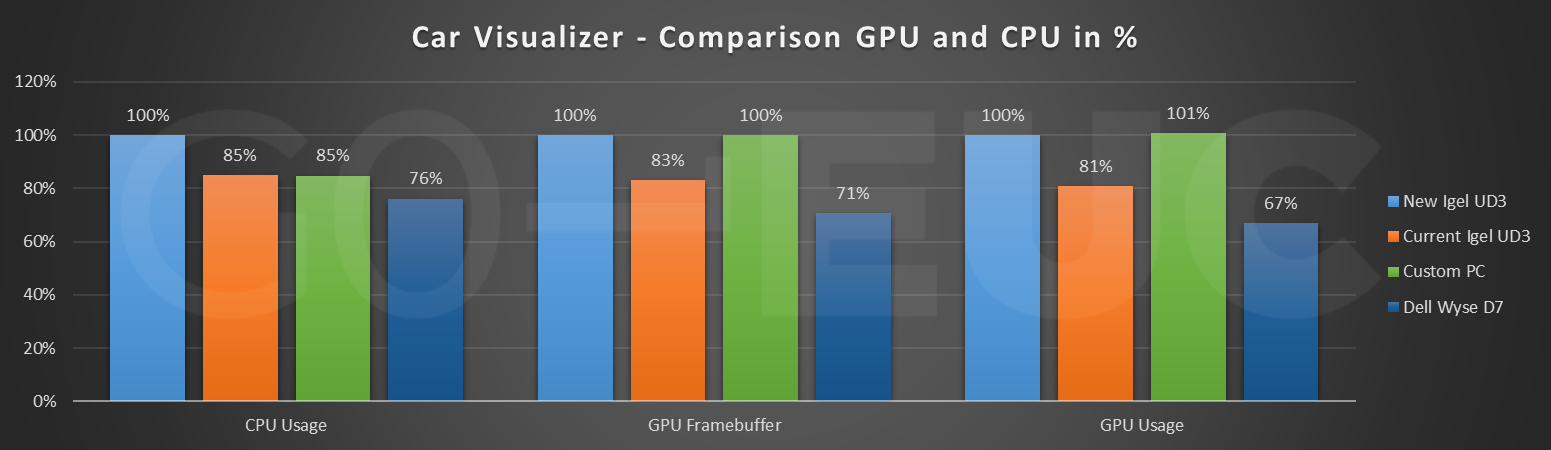
When using GPU enabled applications like in the Car Visualizer video samples shown above, there is a huge difference in experience between the selected devices. While the video is lagging behind for the current UD3 and the Dell Wyse, the audio experience is even worse. The new UD3 is coping better and is performing almost as good as the custom pc. Visually the new UD3 is only lacking behind slightly and this will most probably impact the perceived user experience.
Lower is better
Lower is better
Lower is better
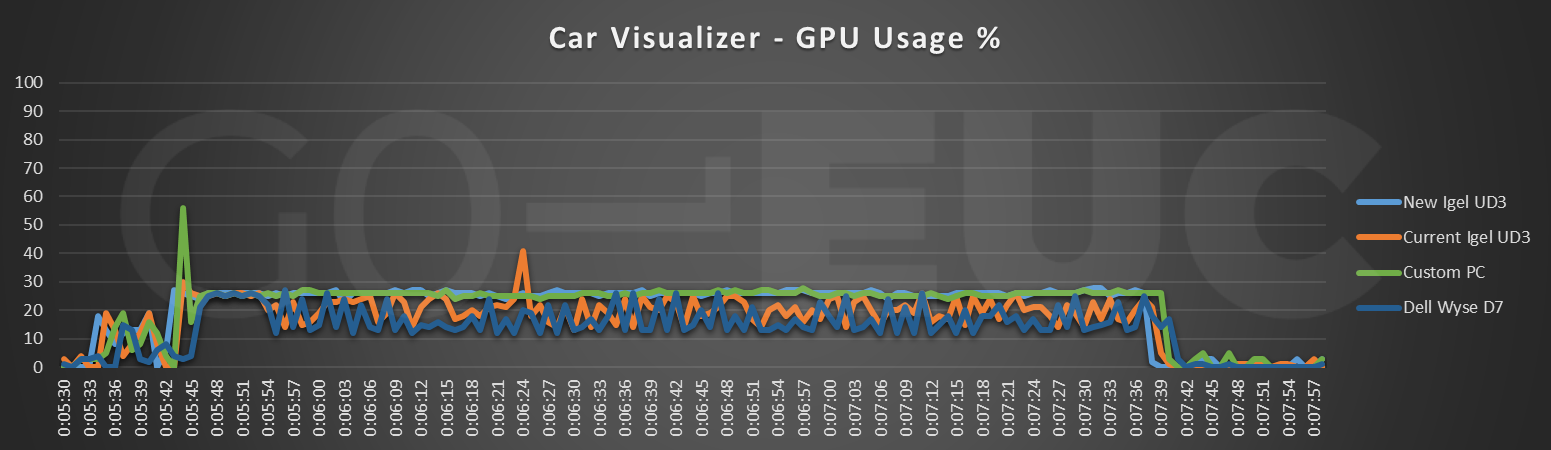
The GPU metrics show a consistent line for the GPU and framebuffer usage in the linechart, whilst the metrics for the older devices are erratic and considerably lower than the newer devices.
Higher is better
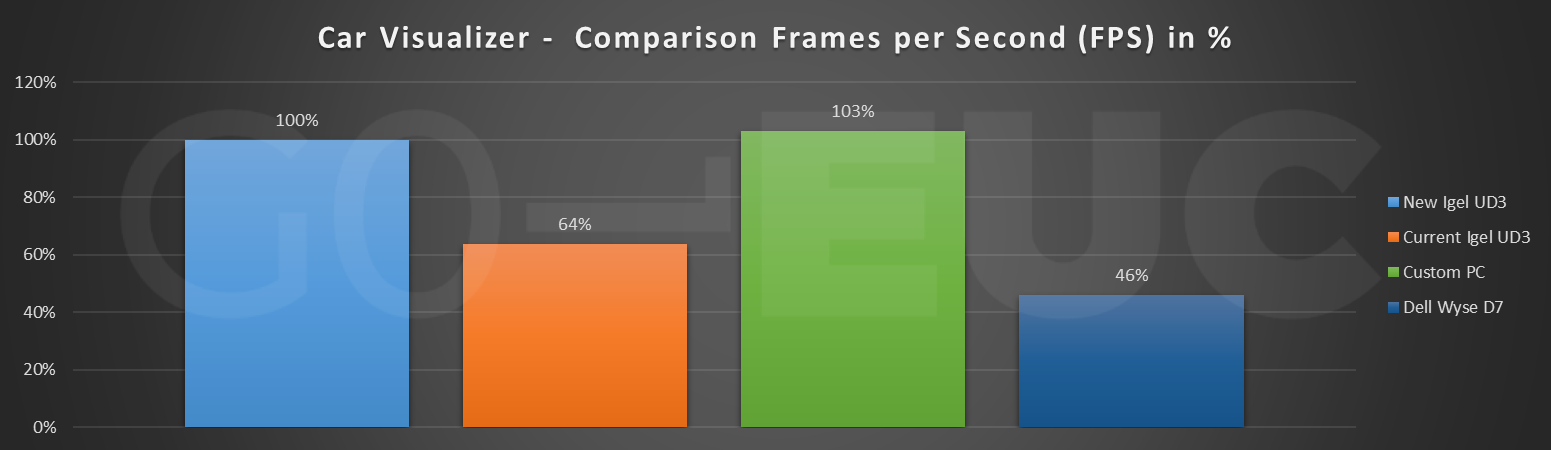
Higher is better
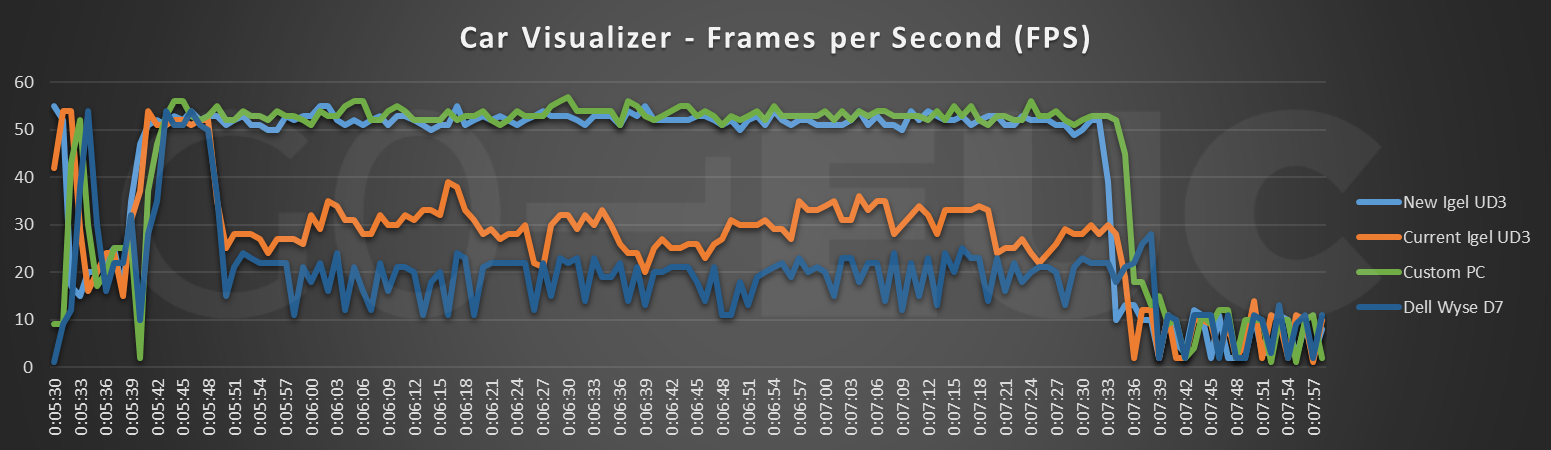
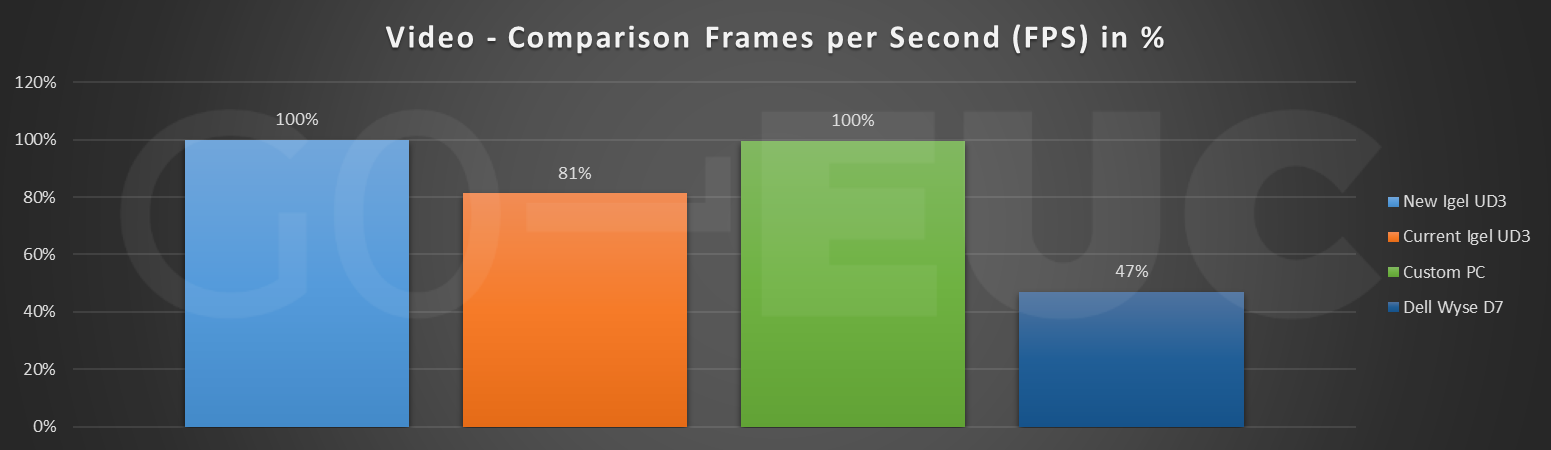
The FPS charts shows the same trend as the GPU usage: whereas the new UD3 and the custom PC are able to deliver close the configured maximum of 60fps, the older devices clearly trail behind.
In contrast to the PowerPoint section where the Wyse did manage to deliver the same amount of frames as the other clients (albeit very slow), this is not the case for the Car Visualizer. Here the Wyse is only able to deliver 46% of the frames compared to the new UD3 and the custom PC.
In the last section of the workload a full HD 60 FPS video is shown, same as previous section it is expected to see a big difference between the thin clients.
Directly from the start of the video it’s very clear that the older devices are unable to show the 60 FPS video.
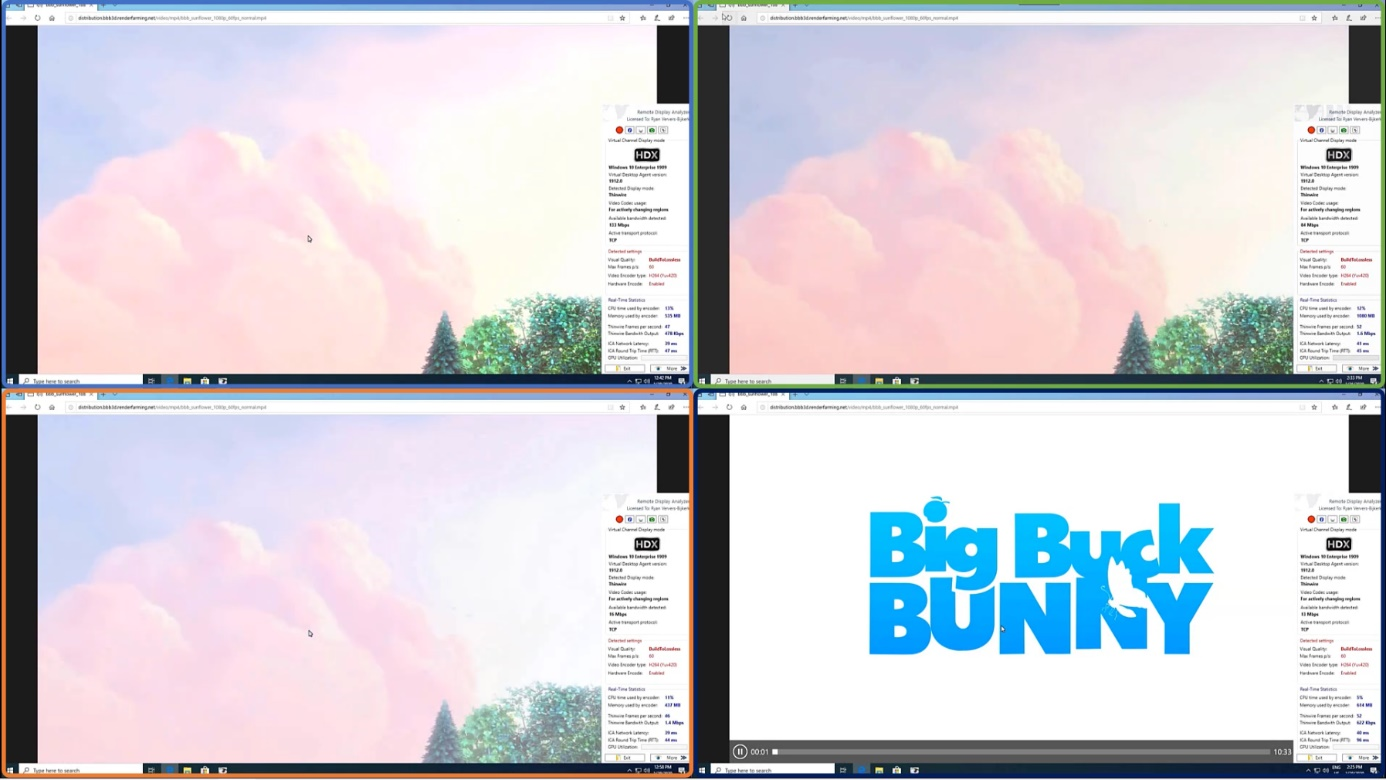
Even in the initial section of the video where there is only the Big Buck bunny Logo animation shown, with only minimal sections of the screen that are changing, the Wyse is already 14 seconds behind.
Lower is better
Lower is better
Lower is better
Lower is better
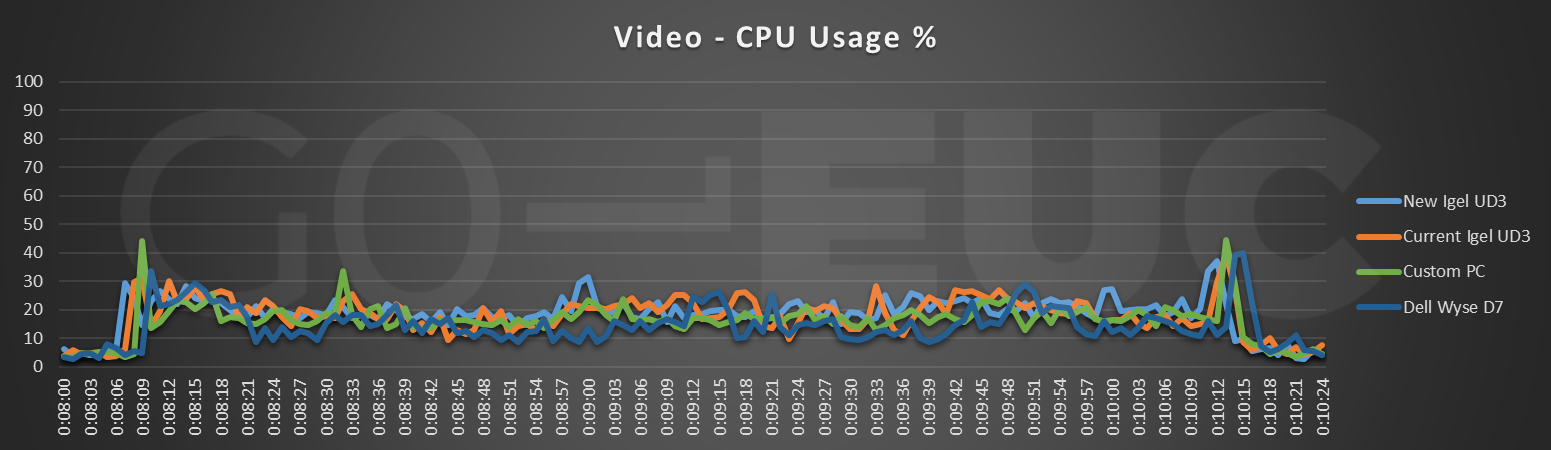
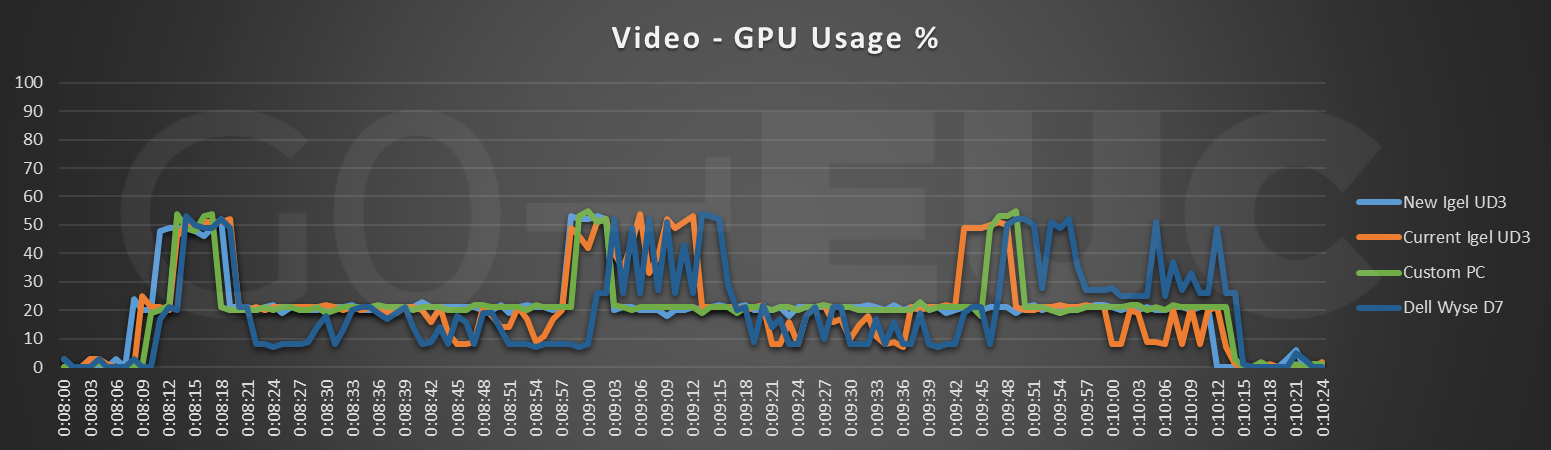
The GPU is able to offload most of the processing. The metrics show only a minor increase in CPU usage for the 60FPS video compared to the Car Visualizer CPU data.
The GPU utilization however, is much higher than for the Car Visualizer. The video relies heavily on the GPU to encode all the video frames in a H.264 stream that is send over to the client.
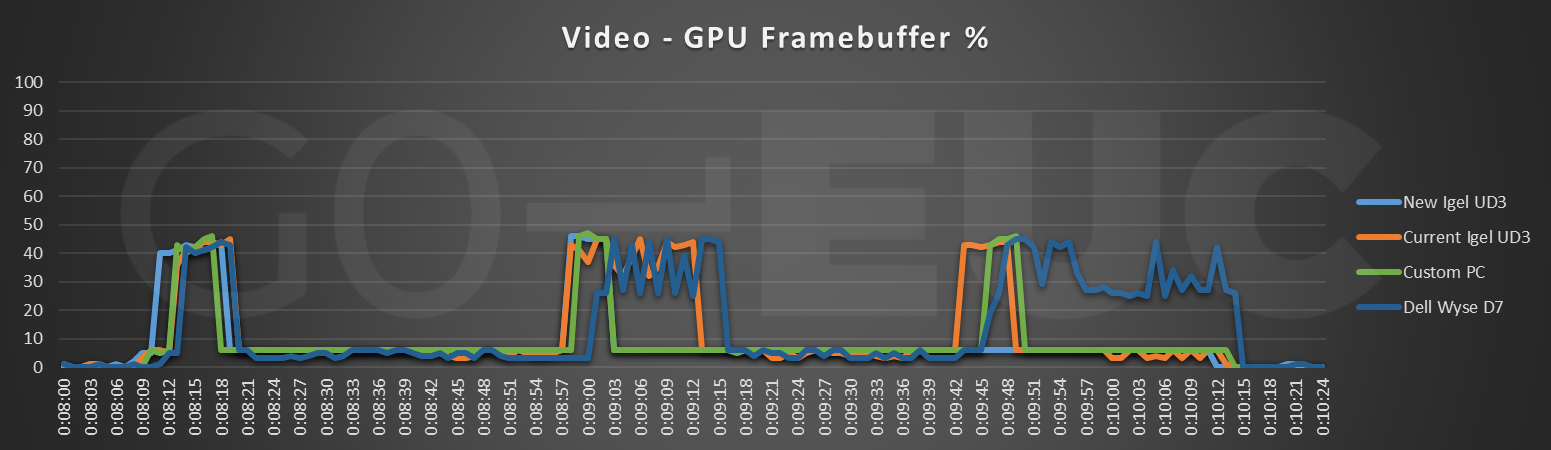
Framebuffer usage is huge compared to the other sections of the workload. Please note that the line chart for the Dell Wyse thin client advanced longer that the line charts for the other clients, this is the result of the fact that the Wyse cannot keep up with 60 FPS stream.
Remember that these tests are running as a single user test and in some sections there the framebuffer usage almost reaches 50%.
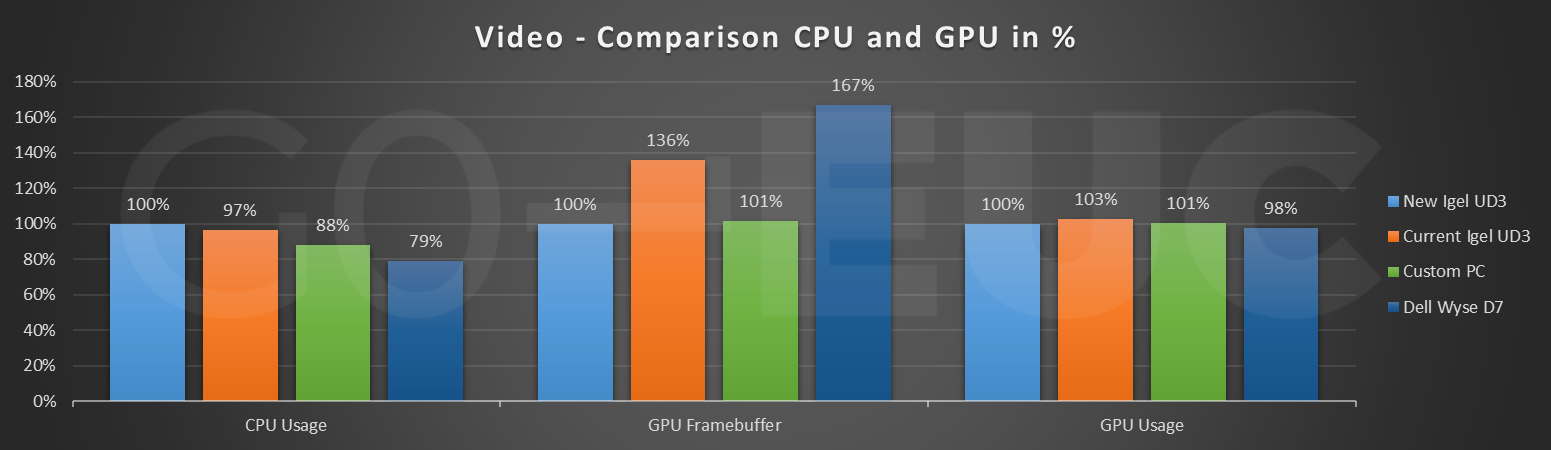
Based on the results shown above, it is expected to see consistent 60 FPS stream from the remoting protocol.
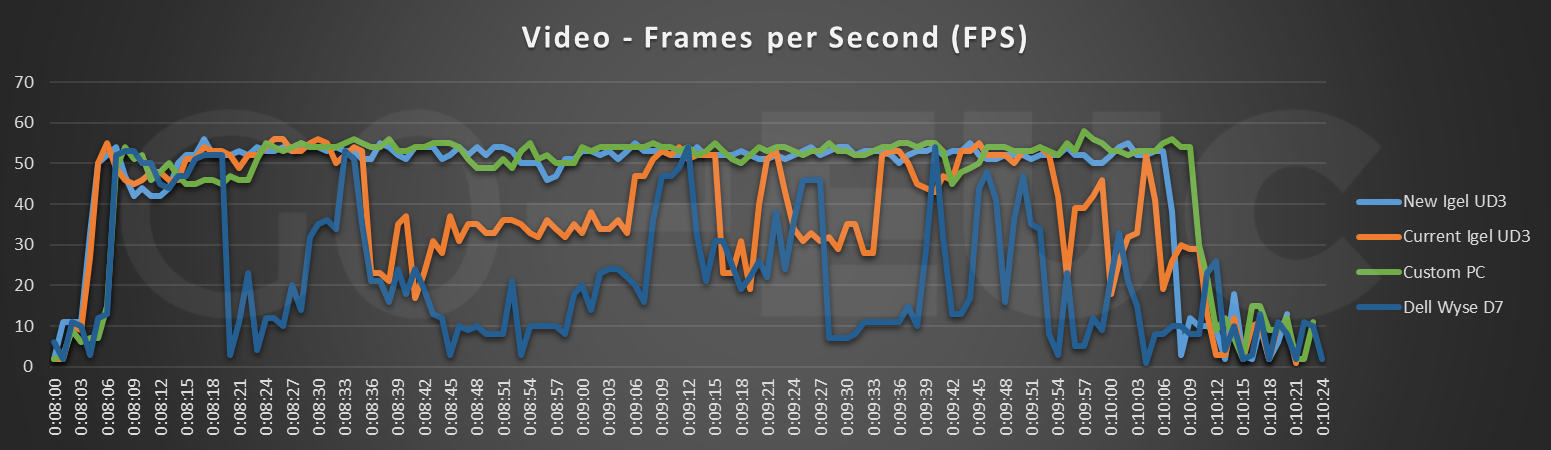
Higher is better
Higher is better
The FPS metrics are similar to the previous section, as the Dell Wyse D7 is not able to handle this type of content. The two best performing devices are able to deliver a consistent 60 FPS steam without any problems.
The goal of this research was to bring attention to the end point and show the importance given the certain workloads.
Depending on the workload and use case the endpoint is an essential section of the equation if you want to deliver the best possible user experience.
Not all workloads rely heavily on the end point but with the changing application landscape where more and more applications benefit from GPU’s in the VDI, the endpoint deserved at least more attention that is has gotten in the past.
Their prolonged usage might seem valid from a cost perspective but if the endpoint doesn’t match the use case anymore the user is getting a subpar experience.
The fact of the matter is that the connecting device plays a significant role in the overall user experience no matter what the workload is.
For the task-worker like workloads the older thin clients can keep up just fine, but for the more graphics intensive workloads they fall behind. The new UD3 from Igel outperformance the other thin client and is, in our particular frame of reference, able to deliver a great user experience even with most intensive sections of the workload.
How do you deal with your thin clients in your environment? Share your experience in the comment below or start the conversation at the Slack channel.
Photo by Mahir Uysal on Unsplash.

Echteld, Netherlands

Malta