


VMware ESXi Memory Management Reimagined: NVMe Tiering vs Traditional Swap


CPU, NUMA and vNUMA topology, including single socket versus multiple sockets, cores per socket, and virtual NUMA alignment, are often discussed in VDI design. At the same time, it is sometimes completely ignored in deployments.
Historically, administrators preferred specific layouts due to scheduler behavior, licensing considerations and early hypervisor co-scheduling constraints. With the evolution of hypervisors and operating systems, it is important to validate whether manual CPU topology tuning still provides measurable benefits.
This research evaluates the impact of CPU topology on virtual desktop environments running a standard knowledge worker workload, providing measurable benefits for performance and efficiency.
Although the test environment is based on Omnissa Horizon Instant Clones, the findings are not limited to this platform and are expected to apply to other VDI solutions as well, including Citrix Virtual Apps and Desktops and Microsoft RDS.
Servers use Non-Uniform Memory Access (NUMA) architecture, where each CPU socket has its own local memory. Accessing memory from another socket introduces latency. VMware ESXi detects the physical NUMA topology and automatically aligns virtual CPUs and memory to maintain locality whenever possible. If a virtual machine fits within a single physical NUMA node, ESXi keeps its vCPUs and memory within that node. Only when a VM exceeds the capacity of a physical NUMA node does ESXi distribute it across multiple nodes and expose virtual NUMA to the guest OS. Improvements such as relaxed co-scheduling and NUMA-aware CPU scheduling have significantly reduced historical performance penalties.
Before ESXi 4.1, virtual machines were not NUMA-aware, which could result in larger VMs accessing memory across multiple NUMA nodes. This cross-node memory access increased latency and reduced performance.
ESXi 4.1 introduced virtual NUMA (vNUMA), allowing virtual machines that exceed the capacity of a single physical NUMA node to expose multiple virtual NUMA nodes to the guest operating system. This enables NUMA-aware guest operating systems to optimize memory allocation and CPU scheduling based on the topology presented by the hypervisor. When a virtual machine becomes large enough to span multiple physical NUMA nodes, ESXi automatically exposes vNUMA to the guest operating system to reflect the underlying topology.
In later vSphere releases, the NUMA scheduler and automatic placement logic were further refined. For example, starting with vSphere 6.5, NUMA client creation was decoupled from the virtual machine’s cores-per-socket configuration, allowing ESXi to determine the optimal virtual NUMA topology more intelligently while still allowing administrators to configure advanced NUMA settings when required.
In recent vSphere versions, administrators can influence the virtual NUMA topology through settings such as NUMA nodes per socket in the vSphere Client.
When multiple vNUMA nodes are presented to a VM, the guest operating system detects this topology and schedules workloads accordingly. Modern operating systems are NUMA-aware and can optimize thread scheduling and memory allocation based on the NUMA layout exposed by the hypervisor.
Changing the number of vNUMA nodes in the VM configuration changes the NUMA topology exposed to the guest operating system.
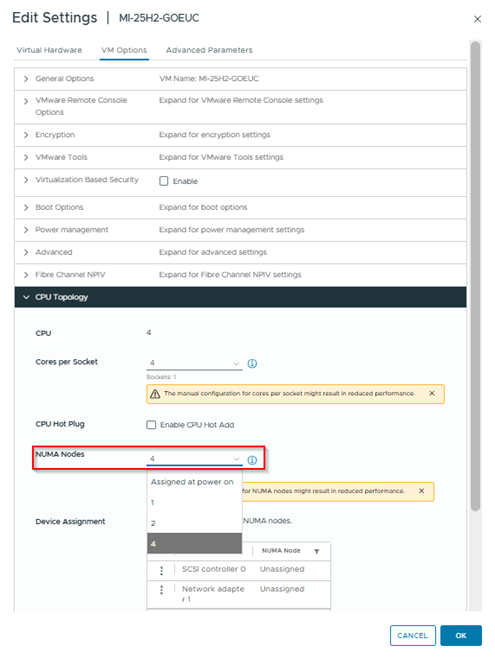
NUMA Nodes configuration on a Virtual Machine
This can be verified within the guest VM. for example in a Windows VM using Windows performance counters or WMI queries such as the following powershell command:
(Get-WmiObject Win32_PerfFormattedData_PerfOS_NUMANodeMemory | Where-Object { $_.Name -ne "_Total" }).Name.Count
For example configuring 4 vNUMA nodes on a Virtual Machine will give you a result of 4 with this command:
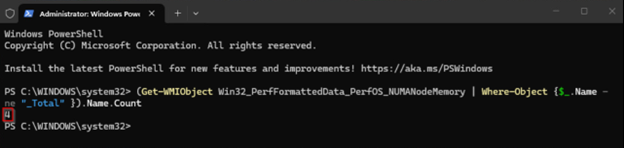
Output of number of vNUMA nodes seen by the Virtual Machine
But, if a VM still fits within a single physical NUMA node, increasing the number of vNUMA nodes does not change the underlying physical memory locality. Instead, it only changes the topology presented to the guest OS, allowing testing of operating system scheduling behavior without spanning multiple physical NUMA nodes. More about this in this performance study: chapter Sockets and NUMA
Despite advancements in hypervisor scheduling and automatic vNUMA alignment, CPU topology recommendations are still frequently referenced in VDI design discussions. Traditional guidance often suggests carefully configuring cores per socket or manually defining virtual NUMA nodes to optimize performance, even for relatively small virtual desktops.
In more recent versions of VMware ESXi, the scheduler is capable of automatically aligning vCPUs and memory to physical NUMA boundaries.
For virtual machines that fit entirely within a single physical NUMA node, manual CPU topology adjustments may therefore have limited or no practical impact.
However, VDI environments often operate under conditions that differ from typical server workloads. High host density, bursty login storms, and simultaneous user activity may amplify scheduling behavior or introduce contention that could expose performance differences between CPU topology configurations.
This raises the question of whether historical CPU topology tuning practices remain relevant for VDI environments.
The infrastructure used for this validation was selected to provide sufficient compute, memory, and storage resources for high-density VDI workloads, while minimizing external bottlenecks that could influence CPU topology results.
Resource Infrastructure
VDI Infrastructure
VDI Platform
With 4 vCPUs per virtual desktop, each VM resides entirely within a single physical NUMA node, ensuring local memory access and minimal cross-node latency.
This configuration results in the following NUMA layout:
| Section | NUMA Node 0 | NUMA Node 1 |
|---|---|---|
| Virtual vCPUs | 0–127 (32 VMs × 4 vCPUs each) | 128–255 (32 VMs × 4 vCPUs each) |
| Virtual RAM Assigned | 32 × 8 GB = 256 GB | 32 × 8 GB = 256 GB |
| Physical DRAM | 384 GB | 384 GB |
| Physical Cores | 8 cores (Core 0–7) | 8 cores (Core 10–17) |
| Threads | 16 HT (2 per core) | 16 HT (2 per core) |
| PCPU Blocks | 8 PCPU blocks | 8 PCPU blocks |
Golden Image Configuration
Four configurations were evaluated by adjusting the settings on the VM used for the Master Image. The settings are propagated during the provisioning process to the Instant Clones:
If a VM still fits within a single physical NUMA node, increasing the number of vNUMA nodes typically does not change the underlying physical memory locality.
This research evaluates the performance and user experience impact of different infrastructure topologies using the Login VSI Knowledge Worker 2022 default workload. The Knowledge Worker profile simulates end-user behavior, including common office applications, web browsing, and document handling, providing a representative workload for digital workspace environments.
Each test scenario was executed with 64 concurrent sessions, following a 16-minute ramp-up period to gradually introduce user load in a controlled manner. The 16-minute ramp-up results in a ramp-up of 4 sessions a minute.
After the final session was established, a 14-minute steady-state phase was maintained to capture stable performance characteristics under consistent load. To eliminate cross-test influence and ensure that results were not affected by residual resource utilization, a 900-second idle period was enforced between consecutive runs. All topology scenarios were executed under identical configuration, workload, and timing conditions to ensure reproducibility and enable objective comparison.
Performance and infrastructure data were collected centrally in InfluxDB. Metrics were gathered primarily using Telegraf agents. Where native metric collection was not available, custom PowerShell scripts were used to retrieve and forward the required data. This approach ensured consistent metric ingestion, standardized time-series storage, and reliable cross-scenario comparison.
Each scenario was executed seven times. Performance metrics presented in the results section represent the averaged values across all runs to reduce run-to-run variability and highlight structural performance differences between topology configurations. The graphs shown represent the mean value across all seven runs for each scenario.
Metric: Number of concurrently active user sessions during the test Risk indicator: High load, potential host/resource saturation Source: Direct count from LoginVSI test run
Active sessions followed a consistent pattern across all four scenarios during ramp-up, steady state, and cooldown. Each scenario gradually increased to the peak of ~64 sessions, remained stable during steady state, and declined simultaneously during logoff.
Scenario 2 (4 vNUMA) and Scenario 4 (auto vNUMA) reached peak sessions slightly faster, while Scenario 1 (1 vNUMA) and Scenario 3 (2 vNUMA) followed closely. These differences are minimal and within normal run variation.
At peak load, all scenarios sustained the same number of active sessions and showed identical cooldown behavior. Overall, vNUMA configuration did not result in any meaningful difference in session capacity or stability.
Metric: End-User Experience Score (LoginVSI) Risk indicator: Lower score indicates degraded user experience Source: Direct count from LoginVSI test run
All four scenarios follow a similar EUX score pattern during ramp-up, peak load, and steady state. Scores initially rise, especially during login activity, decline as load increases, and stabilize once logins are complete and the environment reaches steady state. This is expected behavior for the EUX metric, as higher load leads to more resource sharing.
Scenario 2 shows a slightly deeper dip during peak load, indicating marginally higher contention. Scenario 3 shows minor oscillations during this phase, while Scenario 1 and Scenario 4 remain closely aligned.
During steady state, all scenarios converge and stabilize around similar EUX score levels. Overall, the results show no structural EUX advantage for any vNUMA configuration, with only small transient differences during peak contention.
Additional information on the EUX Score: Login Enterprise EUX score and VSImax - Login VSI
Metric:Percentage of time a VM is ready to run but waiting for physical CPU Risk indicator: Host CPU contention or overcommitment Source: VMware vSphere VM performance counter cpu.ready.summation, converted to percentage over the sample interval and vCPU count Calculation:CPU Ready % = (Total CPU Ready Time ÷ (Sample Interval × vCPU count)) × 100
CPU Ready is one of the primary performance metrics in virtualized environments because it measures how often a virtual machine is ready to execute but is waiting for access to physical CPU resources. High CPU Ready values indicate CPU contention on the host, which can directly impact application responsiveness and end-user experience.
Monitoring this metric helps identify whether CPU scheduling delays may be impacting workload performance.
The following table summarizes typical CPU Ready percentages, observed behavior, and the expected impact on end-user experience in a VDI environment
| CPU Ready % | Observation | Impact on User Experience |
|---|---|---|
| 0-3% | Low CPU wait time | Users experience smooth logins and responsive applications. |
| 3-5% | Moderate CPU wait time | Minor delays may occur during sustained peak activity, brief spikes are unlikely to affect users. |
| 5-10% | Elevated CPU wait time | Some lag may be noticeable if sustained, short peaks are generally tolerated. |
| >10% | High CPU wait time | Performance may be affected if sustained, isolated spikes typically have minimal impact. |
Note: A single or brief spike in CPU Ready (e.g., 10%) usually does not significantly impact end-user experience. Only sustained periods of high CPU Ready indicate potential contention that could degrade responsiveness.
CPU Ready increased gradually during ramp-up, stabilized around 10-12% during steady state, and dropped again during cooldown across all four scenarios.
Scenario 1 and Scenario 4 trend slightly higher during peak load, while Scenario 2 remains marginally lower, indicating slightly less CPU contention. Scenario 3 follows a similar pattern to the others.
Overall, differences between scenarios are small and within normal variation, showing no structural impact of vNUMA configuration on CPU Ready behavior.
Metric: Time a vCPU waits in milliseconds because other vCPUs of the same VM must be co-scheduled Risk indicator: Structural co-scheduling delays for multi-vCPU VMs Source: VMware vSphere VM performance counter cpu.costop.summation
Co-Stop Summation measures the total time all vCPUs of a VM are ready to execute but are delayed because they must be scheduled simultaneously. When collected with for example, using the Telegraf vSphere plugin with a 20-second interval, the values are reported in milliseconds and are summed across all vCPUs.
The following table summarizes typical Co-Stop summation values, observed behavior, and the expected impact on end-user experience in a VDI environment, based on 256 vCPUs allocated across the test scenarios.
| Average Co-Stop per vCPU per 20 s (ms) | Total Co-Stop Summation for 256 vCPUs (ms) | Observation | Impact on End-User Experience |
|---|---|---|---|
| 0-500 | 0-128,000 | Minimal scheduling delays | Users experience smooth logins and responsive applications. |
| 500-1,500 | 128,000-384,000 | Minor delays | Occasional slight delays during peak activity, generally tolerated. |
| 1,500-3,000 | 384,000-768,000 | Noticeable delays | Some responsiveness issues may be observed if sustained. |
| >3,000 | >768,000 | High scheduling delays | Sustained delays can impact performance, multi-vCPU VMs may show degraded responsiveness. |
Co-Stop remained near zero during early ramp-up and increased gradually as CPU load grew. All scenarios reached their peak around the same time during maximum workload and declined quickly during cooldown.
Scenario 3 shows the highest peak Co-Stop values, while Scenario 2 consistently trends slightly lower. Scenarios 1 and 4 fall in between with similar behavior. From a total Co-Stop perspective, Scenario 2 shows the lowest average Co-Stop across all sessions, Scenario 3 the highest, and Scenarios 1 and 4 are intermediate.
CPU runtime varies across scenarios: Scenario 2 has the shortest runtime, Scenario 3 the longest, and Scenarios 1 and 4 are intermediate, respectively.
The runtime gap between the fastest and slowest scenario is roughly 58 seconds (~23%).
Metric: Average time a VM waits for CPU scheduling in ms Risk indicator: Host CPU saturation or contention Source: VMware vSphere VM performance counter cpu.latency.average
CPU Latency measures the average time a virtual machine’s vCPUs are ready to run but are delayed waiting for physical CPU resources. It is a key metric for evaluating CPU scheduling performance in virtualized environments.
| CPU Latency (ms) | Observation | Impact on End-User Experience |
|---|---|---|
| 0-5 | Minimal latency | Users experience smooth logins and responsive applications. |
| 5-10 | Low latency | Minor delays may occur during peak activity; generally tolerable. |
| 10-20 | Moderate latency | Some responsiveness issues may be noticeable if sustained. |
| >20 | High latency | Performance may be degraded; sustained high latency can affect VDI user experience. |
CPU latency increased gradually during ramp-up, stabilized around 35-45 ms during steady state, and dropped sharply once the workload ended across all scenarios. Scenario 2 trends slightly lower during ramp-up and steady state also resulting in the lowest CPU latency score when averaged, while Scenario 3 occasionally shows slightly higher peaks. Scenario 1 and Scenario 4 track closely together.
Overall, differences are minor and within normal variation, indicating no structural impact of vNUMA configuration on host CPU latency.
For the tested scenario with knowledge worker desktops with 4 vCPUs:
Adjusting CPU topology in small desktops did not produce measurable differences in EUX scores under typical workloads. Minor improvements were observed only under extreme host congestion, when EUX scores fell below acceptable operational thresholds. Within the scope of this evaluation, manual CPU topology tuning therefore does not present a practical optimization strategy.
All tested desktops fit entirely within a single physical NUMA node. From the Windows guest perspective, modifying the number of vNUMA nodes altered only the logical NUMA topology presented to the scheduler. Physical memory locality remained unchanged, but multiple vNUMA nodes create additional logical boundaries that may influence how the Windows scheduler distributes threads under conditions of high CPU load. This can explain minor variations in co-stop or scheduler latency observed under extreme host congestion.
Due to the non-persistent and floating nature of Instant Clones, combined with the random assignment of clones to sessions during the load test, these scheduler effects are subtle and highly variable at the per-VM level. Consequently, these effects as a result are not directly or consistently observable in individual NUMA or CPU metrics within the guest VM and are primarily reflected through aggregated EUX scores under stressed conditions.
Does vCPU topology influence user experience in VDI environments, as measured by LoginVSI EUXscore?
For desktops with 4 vCPUs in this scenario , CPU topology did not measurably affect EUX scores or session responsiveness under typical workloads
Does splitting vCPUs across multiple vNUMA nodes provide measurable performance improvements?
Multi vNUMA configurations provided no measurable benefit under normal conditions. Minor improvements were observed only under extreme host congestion, when EUX scores fell below considered acceptable thresholds; however, these improvements are not considered a reliable tuning strategy.
Does manual NUMA configuration provide benefits compared to automatic NUMA placement in ESXi?
Automatic NUMA placement in ESXi 8.0.3 Update 3 effectively aligns compute and memory locality for small desktops under normal load. Manual vNUMA adjustments generally did not improve EUX scores or scheduler metrics, though marginal improvements were observed under extreme CPU congestion, conditions outside typical operational thresholds.
In desktop virtualization environments running knowledge worker workloads, host sizing, density planning, and load management are the primary factors influencing end-user experience, while manual CPU or vNUMA topology tuning typically provides negligible benefit. Although this study was conducted using Omnissa Horizon Instant Clones, the findings are not platform-specific and are expected to apply broadly to other desktop virtualization solutions such as Citrix Virtual Apps and Desktops and Microsoft RDS. Adjusting vNUMA configuration changes the logical NUMA topology visible to the Windows scheduler, but measurable performance effects are generally limited to extreme host congestion conditions and are primarily observable through aggregated EUX metrics.
As expected, configuring a single NUMA node on the client produces results nearly identical to the auto-NUMA configuration, since the auto mode resolves to one NUMA node in this scenario.
Based on this study, maintaining CPU Ready below ~5% per VM corresponds to a stable EUX score of ~7.5, aligning with VMware best practices for predictable end-user experience in higher-density VDI environments.
In theory, certain specialized workloads, such as single-threaded, memory-intensive applications, could benefit from NUMA-aware vCPU placement; however, these scenarios were outside the scope of this research and were not evaluated.
Would you be interested in a follow-up research exploring larger VDI configurations that exceed a single NUMA node, comparing scale-out versus scale-up architectures, or examining specific workloads such as single-threaded, memory-intensive applications?
Let us know!
Photo by Minku Kang on Unsplash

Berlin, Germany

Billund, Denmark

Nieuwegein, Netherlands

Malta