
Table of Contents
Performance testing websites is not something that is in the comfort zone for GO-EUC. Normally GO-EUC writes researches on the performance and scalability from a EUC perspective, and that is indeed our primary focus with GO-EUC.
This research however is taking a different approach and focuses on the performance differences between a website hosted in WordPress versus one hosted on Github pages using Selenium and Python for testing.
Background information
And now for something completely different
This is the famous catchphrase from Monty Python that was used from their television show and the title for their 1971 British comedy film. There are several reasons to start with this quote. First of all, as mentioned in the introduction website testing is not something GO-EUC normally undertakes, it is not in our regular comfort zone. So for GO-EUC this is definitely something completely different but it is however, perhaps a way to reach a broader audience.
Secondly whilst GO-EUC normally predominantly uses PowerShell, this research uses Python. Again that is something completely different once again and also ties in nicely with the Monty Python quote (and yes that was a very bad word pun).
A while ago the GO-EUC website was moved from WordPress to Github pages and apart from some style changes you, the audience, should not have noticed much from that change. But one of the primary drivers to move away from Wordpress had everything to do with performance. Over time the GO-EUC website became slower and slower.
Whilst no quantitative tests were performed to validate this, it was getting more and more apparent. Because we never dove into the specifics and the data behind the observations that it had become slower, it was just an opinion. And without data, you’re just another person with an opinion.
Recently there was a similar exercise done for another community initiative called TeamRGE, where Ryan and I are both a member of, and this time data was collected. Data we thought would be interesting to share along with the data collecting process.
More info on TeamRGE can be found on their new website: https://www.teamrge.com
One of the pioneers of computer interaction studies was Robert B. Miller. In the 1960s he wrote an article titled ‘Response time in man-computer conversational transactions’: Response Time in Man-Computer Conversational Transactions
Abstract:
The literature concerning man-computer transactions abounds in controversy about the limits of “system response time” to a user’s command or inquiry at a terminal. Two major semantic issues prohibit resolving this controversy. One issue centers around the question of “Response time to what?” The implication is that different human purposes and actions will have different acceptable or useful response times.
A response time of one tenth of a second is viewed as instantaneous, a response within 1 second is fast enough for users to feel they are interacting freely with the information. The upper limit of the response times should stay below 10 seconds to keep the user’s attention focused.
Millers research concludes that for effective communication a response should be presented to the end user within two seconds after the end user started the request. This 2 second response time was viewed as the ideal response time by Miller.
Just like performance is linked very closely to end user experience in End User Computing, this also holds true for websites, whether they are internal websites like Microsoft Sharepoint or the GO-EUC website for example.
Setup
As expected, because this was a different kind of research this also meant a different setup because the standard testing methodology didn’t apply here.
For this research the GO-EUC lab was not used, and instead all of the tests were conducted from my personal workstation: a Dell XPS 13 2020 model with a Intel Core i7 1065G7 processor and 16GB of memory running Windows 10 Pro 20H2.
For the webbrowser, Chrome 64-bit version 88.0.4324.190 was used, which was the latest version available at time of testing.
As mentioned in previous GO-EUC researches, as a general rule it would not be advisable running tests from a personal device because we cannot rule out any outside influence here. For example I had Teams running and Defender ATP was still turned on, which all could influence the results.
However, because the focus is on the comparison between the two scenarios and both tests are performed on the same machine under the same conditions, and both tests were done relatively quickly after each other, the variances between the two tests should not have a significant influence on the overall results.
In order to simulate the tests, a custom Python script in combination with the Selenium framework is used.
Selenium is a web testing framework that can be used to automate browsers. It consists of a WebDriver for the browser used (in this case Chrome was used and therefore the Chrome WebDriver), and a Python script to automate loading the webpages and gathering the testing results. The WebDriver is the component that drives a browser natively, as a user would, either locally or on a remote machine using the Selenium server. Always make sure to match the Chrome version and the Chrome WebDriver versions: WebDriver for Chrome (chromium.org)
More information on Selenium can be found on their website: https://www.selenium.dev/
Please note that Selenium is not primarily designed for web performance testing; it’s a browser automation framework. There are many other frameworks and tools out there that do a much better job, but in this specific case it fits the bill.
In the script, Selenium was used to open the test hyperlink, measure the time it took to load the page and save the results to CSV file for analysis. These tests were automated and repeated 100 times to get more accurate results.
In order to measure the performance the performance timing events were utilized: https://developer.mozilla.org/en-US/docs/Web/API/PerformanceTiming . The PerformanceTiming interface is a legacy interface which contains properties that offer performance timing information for various events which occur during the loading and use of the current page. This will result in a PerformanceTiming object from which backend performance and the frontend performance were taken as primary data points.
The back-end performance starts measurement starts when the simulated user starts the navigation up until the first response from the backend is registered. The front-end performance measures the time between the moment the user receives the first response from the backend until the DOM is complete.
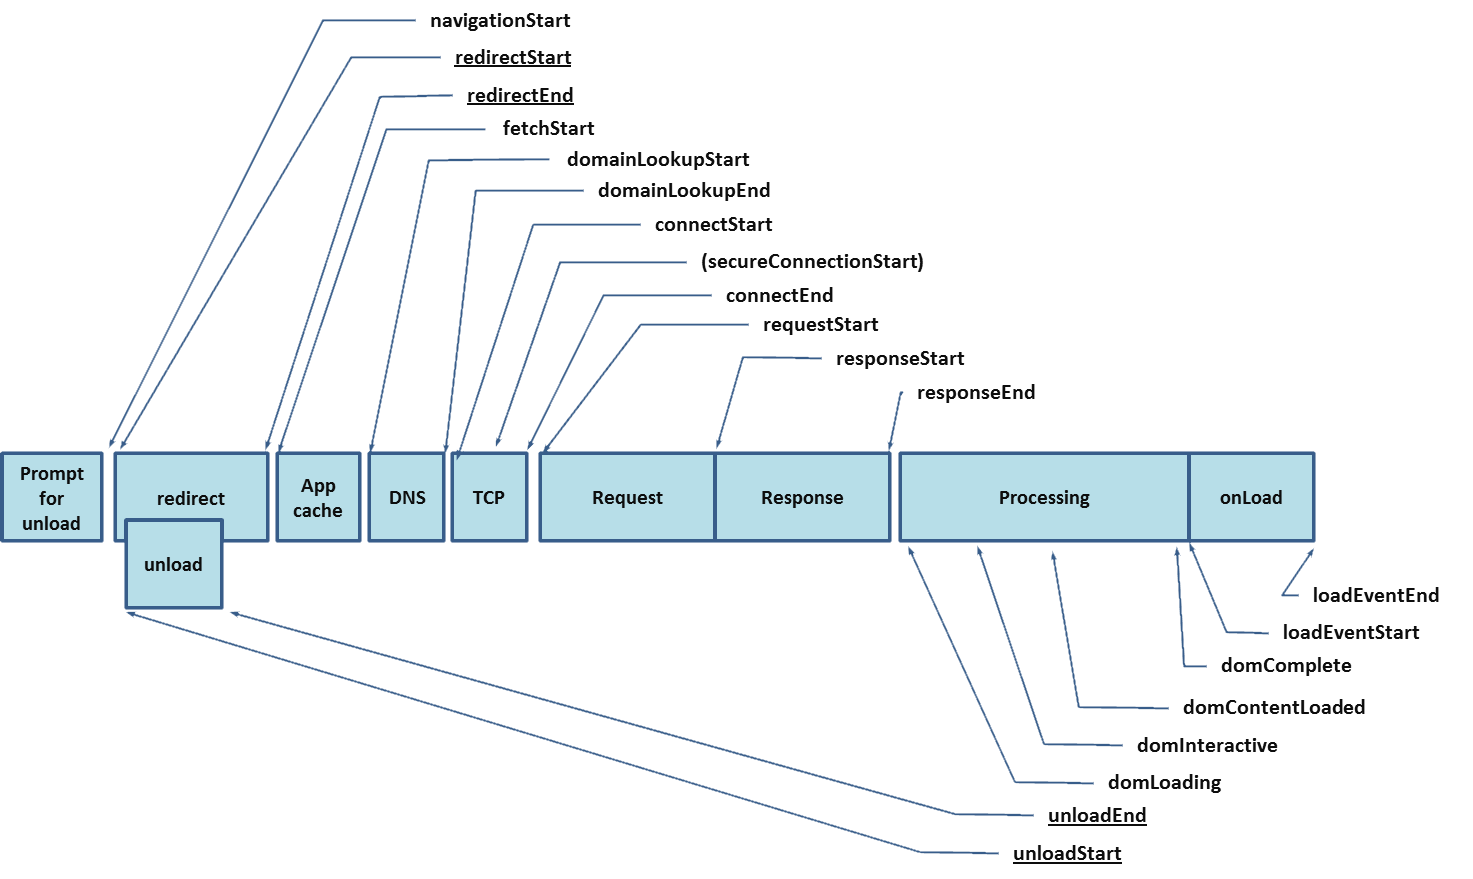
Image courtesy of W3.org
More detailed, the back-end performance measures the flow between navigationStart and responseEnd as shown in the following diagram:
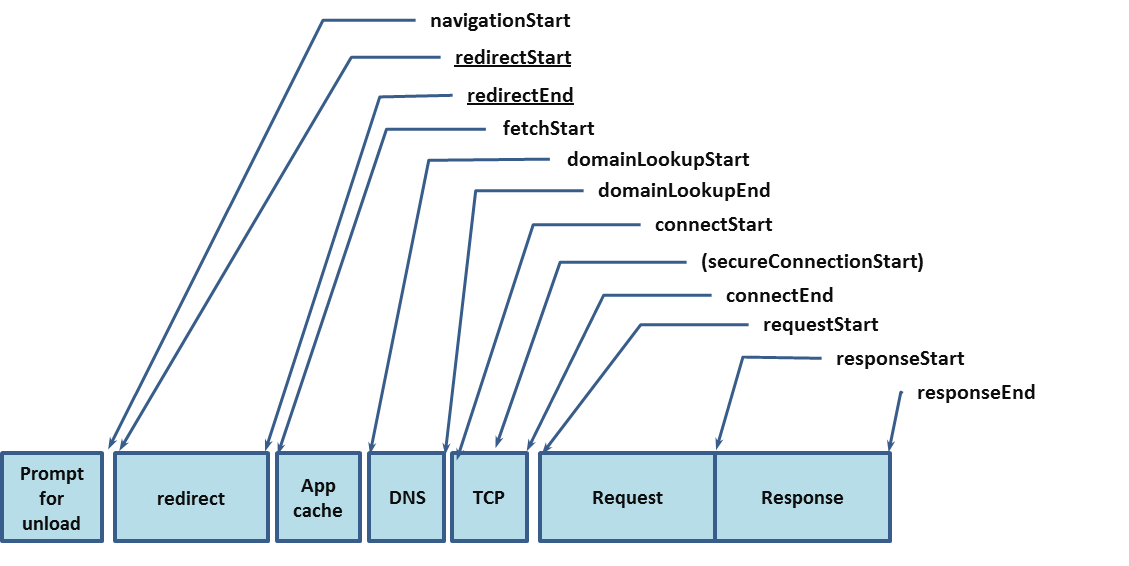
Image courtesy of W3.org
The frontend performance on the other hand is measured from responseStart -> responseEnd -> domLoading -> domInteractive -> domContentLoaded -> domComplete. Illustrated in the diagram below:
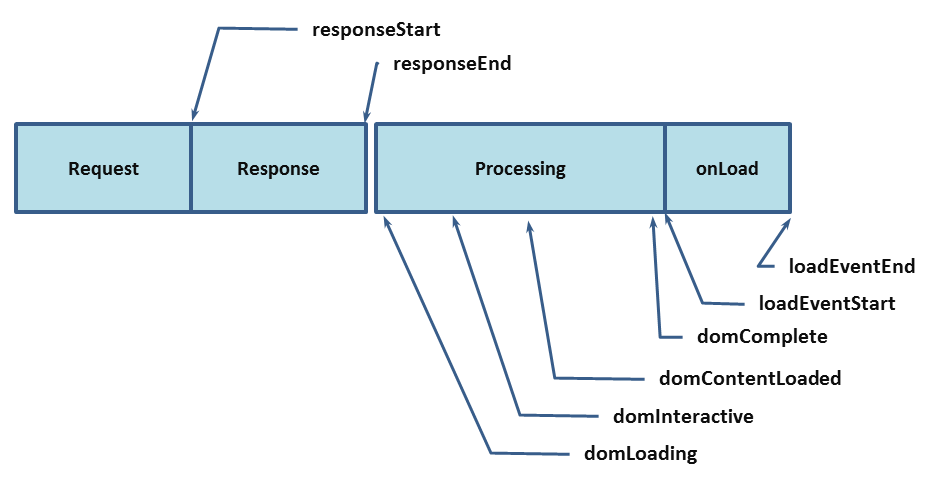
Image courtesy of W3.org
The total loading time can be calculated by adding up the backend and the frontend measurements.
The code used for this research was based upon the code from Marcus Kazmierczak from his 2018 blog post: Use Python + Selenium to Automate Web Timing
The script used is available on GitHub. Please note this is functional code, it’s not meant to run in a production environment. There is only minimal error handeling and the code was only tested on a Windows platform.
Make sure to install the necessary modules: csv and selenium.
The first lines of code import all the necessary modules. In this case we are using not only selenium but also time and csv. The time module is needed to calculate the time it took to measure the Selenium tests and the csv-module to write the data to a datafile, a CSV file in this case.
from selenium import webdriver
from selenium.webdriver.common.keys import Keys
import time
import csv
import os.path
After the modules are loaded in the CSV file is setup
csv_path = "classic_run3.csv"
try:
    file = open(csv_path, 'w', newline='')
    writer = csv.writer(file)
    writer.writerow(["backendPerformance_calc","frontendPerformance_calc"])
except:
    print("error opening or writing to the CSV file!")
finally:
    file.close()
Once the CSV writer is configured, the Chrome WebDriver interface is initialized and the URL to be tested is defined.
#check if webdriver exists
if os.path.isfile('PATH'):
    print ("Chrome WebDriver found")
else:
    print ("Chrome WebDriver not found!")
    exit()

# Setup Chrome WebDriver
driver = webdriver.Chrome(PATH)
hyperlink = "http://www.teamrge.com"
driver = webdriver.Chrome()
Hereafter the number of test iterations is defined and the main loop is created:
iterations = 100
for i in range(iterations):
    driver = webdriver.Chrome(PATH)
    driver.get(hyperlink)

    #Use Navigation Timing API to calculate the timings
    navigationStart = driver.execute_script("return window.performance.timing.navigationStart")
    responseStart = driver.execute_script("return window.performance.timing.responseStart")
    domComplete = driver.execute_script("return window.performance.timing.domComplete")

    backendPerformance_calc = responseStart - navigationStart
    frontendPerformance_calc = domComplete - responseStart

    #print("Back End: %s" % backendPerformance_calc)
    #print("Front End: %s" % frontendPerformance_calc)

    writer.writerow([backendPerformance_calc,frontendPerformance_calc])
    driver.close()
    print("start next iteration")
In the main loop we’ll start the navigation by calling the Selenium method driver.get with the predefined hyperlink as the parameter.
Next driver.execute_script is called and the return value is stored in navigationStart.
driver.execute_script then synchronously executes JavaScript in the current window or frame. In this case the ‘return window.performance.timing.navigationStart’ code is run.
Afterwards some cleanup is necessary to close the CSV file and the WebDriver:
driver.quit()
file.close()
Data
As mentioned previously, from the get-go it was very obvious that the new GitHub pages website that used in this research was much faster than the old WordPress based site. The old WordPress site felt sluggish and cumbersome and it took a very long time to load. The new website was, and is, much snappier and quicker to load.
Below is a small video snippet of both tests running with an iteration set to a value of 5.
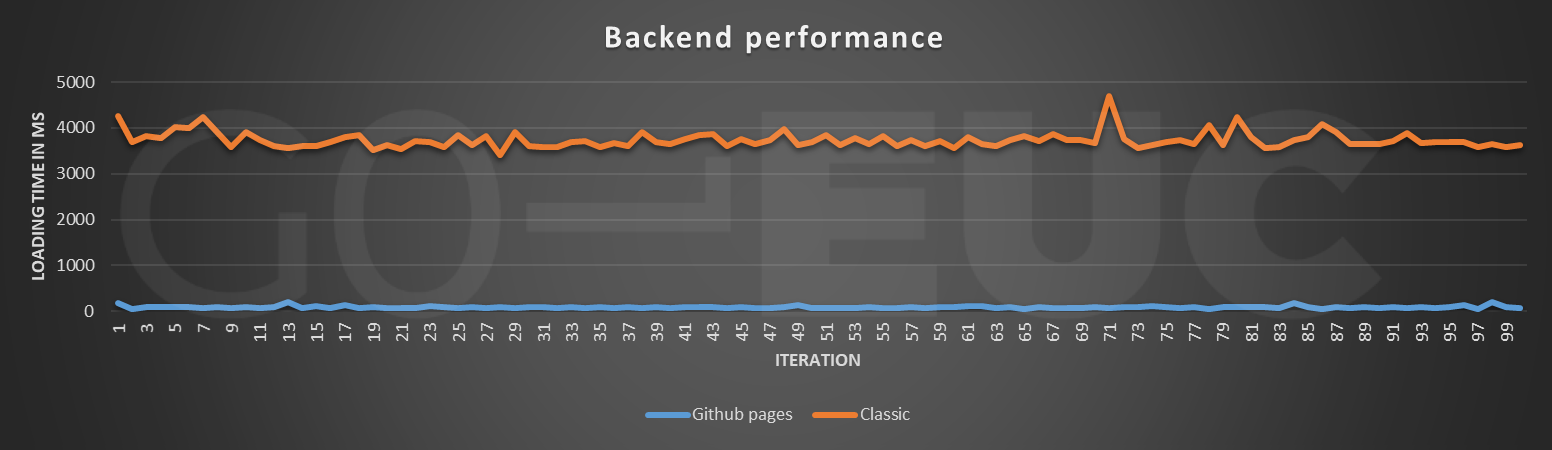
The first data point that was collected was the backend performance. As described in detail earlier, this measurement shows how long it takes from the time the simulated users starts the navigation until the backend responds back to the user.
Lower is better
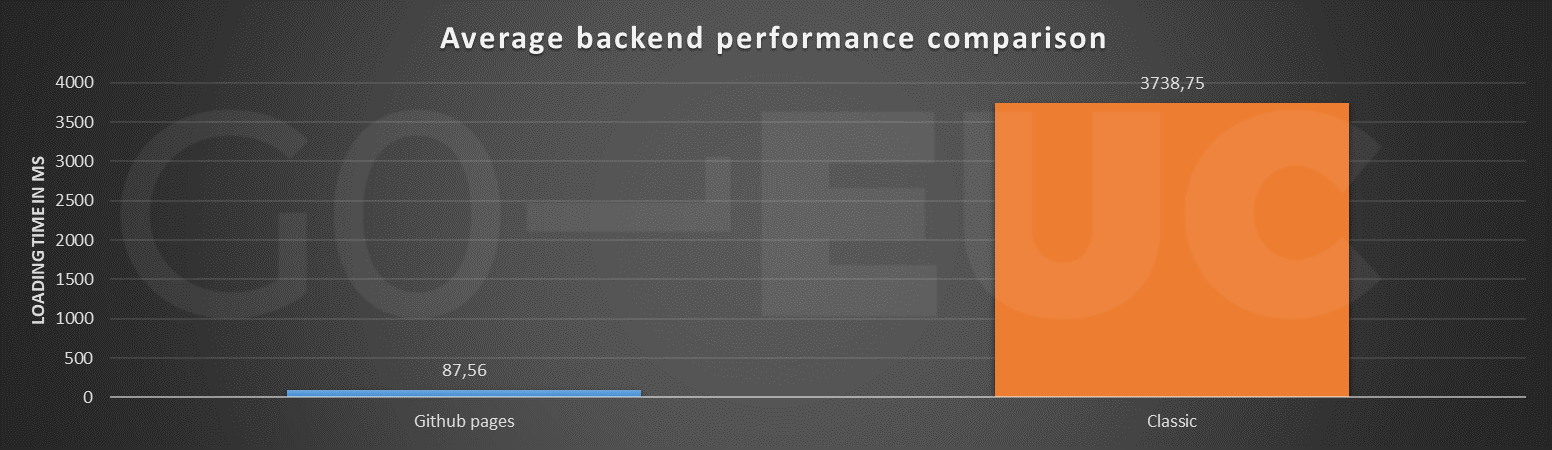
Lower is better
For all 100 tests, the Github Pages perform significantly better than the classic Wordpress website. The average loading time for the backend performance is 74 milliseconds for the Github pages website compared to 3617 milliseconds for the classic Wordpress site. The maximum backend performance measured for the Github pages website was 202 milliseconds whereas the maximum for the classically hosted site was a staggering 4696 milliseconds.
The frontend performance shows a similar trend, although there is more fluctuation in the data this time.
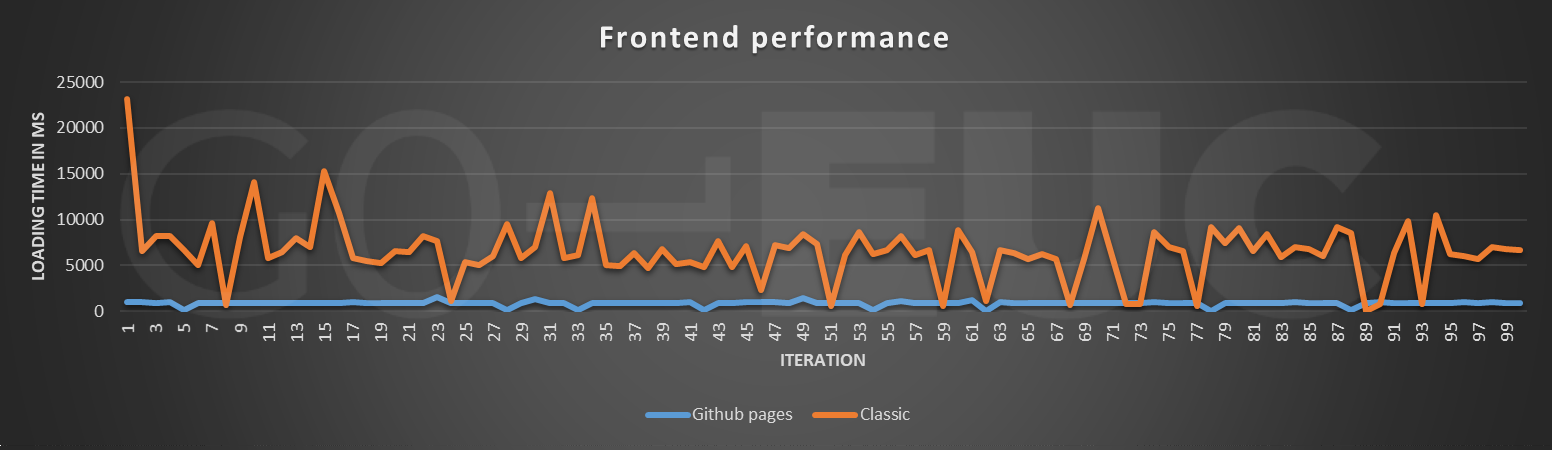
Lower is better

Lower is better
The data for the GitHub pages tests show a much more consistent performance compared to the fluctuations in the data for the WordPress site. On average there is a 689% increase in frontend performance.
The total website loading time can be calculated as follows:
” Backend performance+front end performance=total loading time “
| Data point | GitHub Pages | WordPress |
|---|---|---|
| Average Total loading time | 0,9 seconds | 10 seconds |
| Highest loading time measured | 1,8 seconds | 27 seconds |
Even the longest loading time that was measured for the GitHub Pages website variant, at 1,8 seconds is well under the ideal 2 second mark that Miller defined as explained in the introduction.
This real world example comes with one caveat, the old web hoster for the site tested: namely TeamRGE.com was really, really slow. While performance was one of the key drivers to move to GitHub pages, performance was not the only consideration for the change, but that is out of scope of this research.
As this is just a basic primer on website performance testing, the backend- and frontend performance were the only two metrics collected in this research.
For a more in-depth dive into website performance measuring it is worth noting that the Google Pagespeed APIs can be leveraged which can also be accessed with Python very easily.
For sake of completion the Google PageSpeed data was also collected but that data hasn’t been groomed yet.
While Selenium was not primary developed for the performance testing use case, it is an invaluable tool to use in every performance testers arsenal. Selenium could also be leveraged to test internal websites and can be incorporated in a CI/CD pipeline for automated testing. Selenium also has the capability to make screenshots of websites and can be used in conjunction with image recognition libraries like OpenCV for instance for analysis. The ability to drive web browsers makes it incredibly versatile.
Before we close, we hope you also did enjoy this step outside our regular researches. This was a fun exercise and if you want to see more of these kinds of researches please let us know in the comments or reach out to us on World of EUC Slack channel.
Photo by ThisisEngineering RAEng