

Analyzing Image Quality in Windows 365 Cloud PC: HTML5 Webclient vs. Remote Desktop Client


As mentioned in the introduction post for the Input Latency with NVIDIA LDAT Series There are several compelling alternatives to using NVIDIA’s LDAT tool. This is mainly because the LDAT is not for sale and NVIDIA only makes the tool available for select journalists.
That post also explored two alternative methods for determining the latency, one by using a high speed camera, and secondly by using an DIY solution for building an LDAT alternative. This post will dive a bit deeper into the latter option.
NVIDIA’s Latency Display Analysis Tool (LDAT) is an excellent example of a hardware latency measurement tool for measuring input latency. LDAT allows users to assess the impact of various settings on end-to-end latency, helping to understand the effect of latency on the user experience in environments like gaming and remote working environments.
In this post, the goal is to create a DIY latency measurement setup using a Adafruit QT Py microcontroller and CircuitPython. This project will demonstrate how to build a cheap and customizable alternative for measuring end-to-end latency in gaming and graphics applications or similar use cases like remoting protocols.
It will dive into the hardware and software requirements, provide a step-by-step instruction set for setting up and calibrating the system, and showcase how to interpret the latency data for optimization purposes. For this post, at least a basic understanding of Python and CircuitPython is required.
CircuitPython is an open-source programming language based on Python, and was specifically designed for microcontrollers. Adafruit Industries, a manufacturer for microcontrollers (among other things) is the main contributor behind CircuitPython. CircuitPython is a fork of MicroPython, originally created by Damien George.
According to Wikipedia, in 2019, resources for CircuitPython were moved to circuitpython.org, a move to show that the number of third-party boards using CircuitPython had grown beyond those only manufactured by Adafruit. This includes both CircuitPython for microcontrollers and CircuitPython on single-board computers using a compatibility layer Adafruit named “Blinka”, to access general-purpose input/output functionality and compatibility with a library of over 160 sensors and drivers.
With Circuitpython code can be easily edited on-the-fly, as the microcontrollers will present themselves as USB storage devices when connected to a computer. This means that code can be edited easily with any code- or even text editor, and the changes can be saved directly to the device where the changes can be seen directly.
To create a DIY latency measurement device, two main components are needed, a microcontroller and a compatible light sensor.
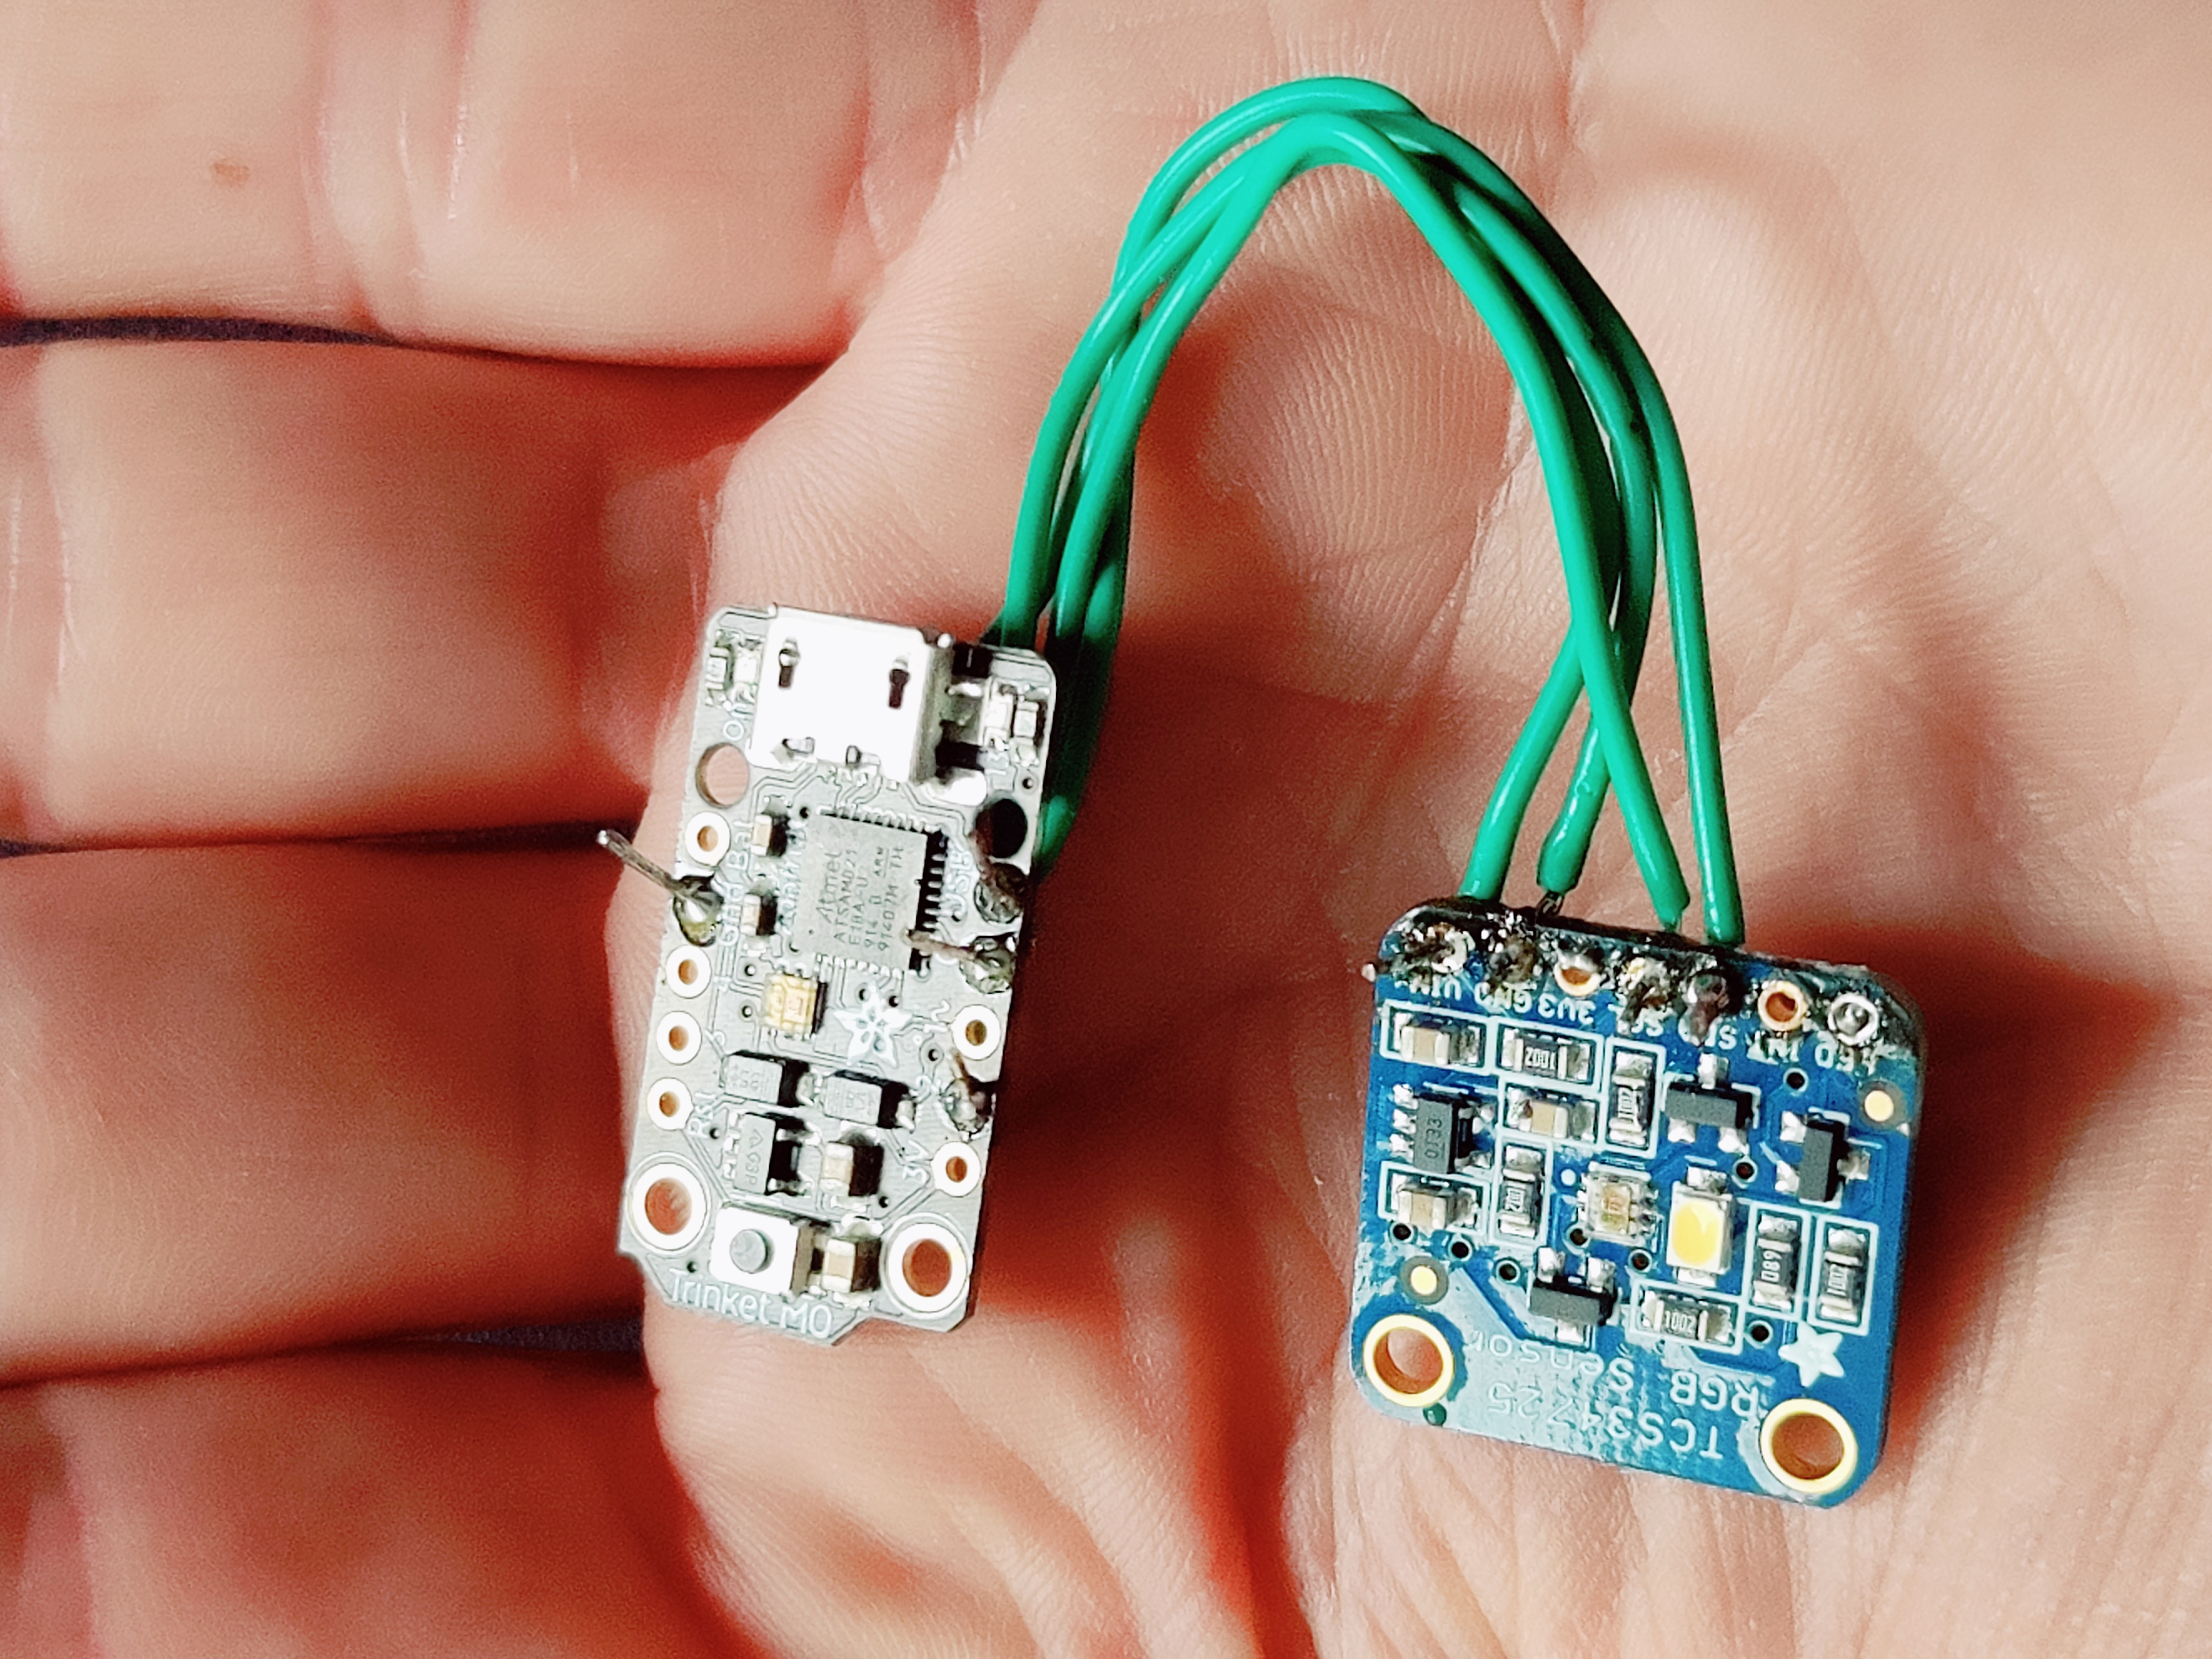
In a previous attempt a Adafruit Trinket M0 was used in combination with a TCS34725 RGB sensor. This setup however required soldering the light sensor board to the microcontroller:
For this setup an Adafruit QT Py was selected mainly because it has a very small form factor, is relatively cheap and it has a Stemma QT connector onboard.
Stemma QT is a plug-and-play system for I2C (Inter-Integrated Circuit) devices, that makes it simple to connect sensors, displays, and other electronic components to microcontrollers without the need for soldering.
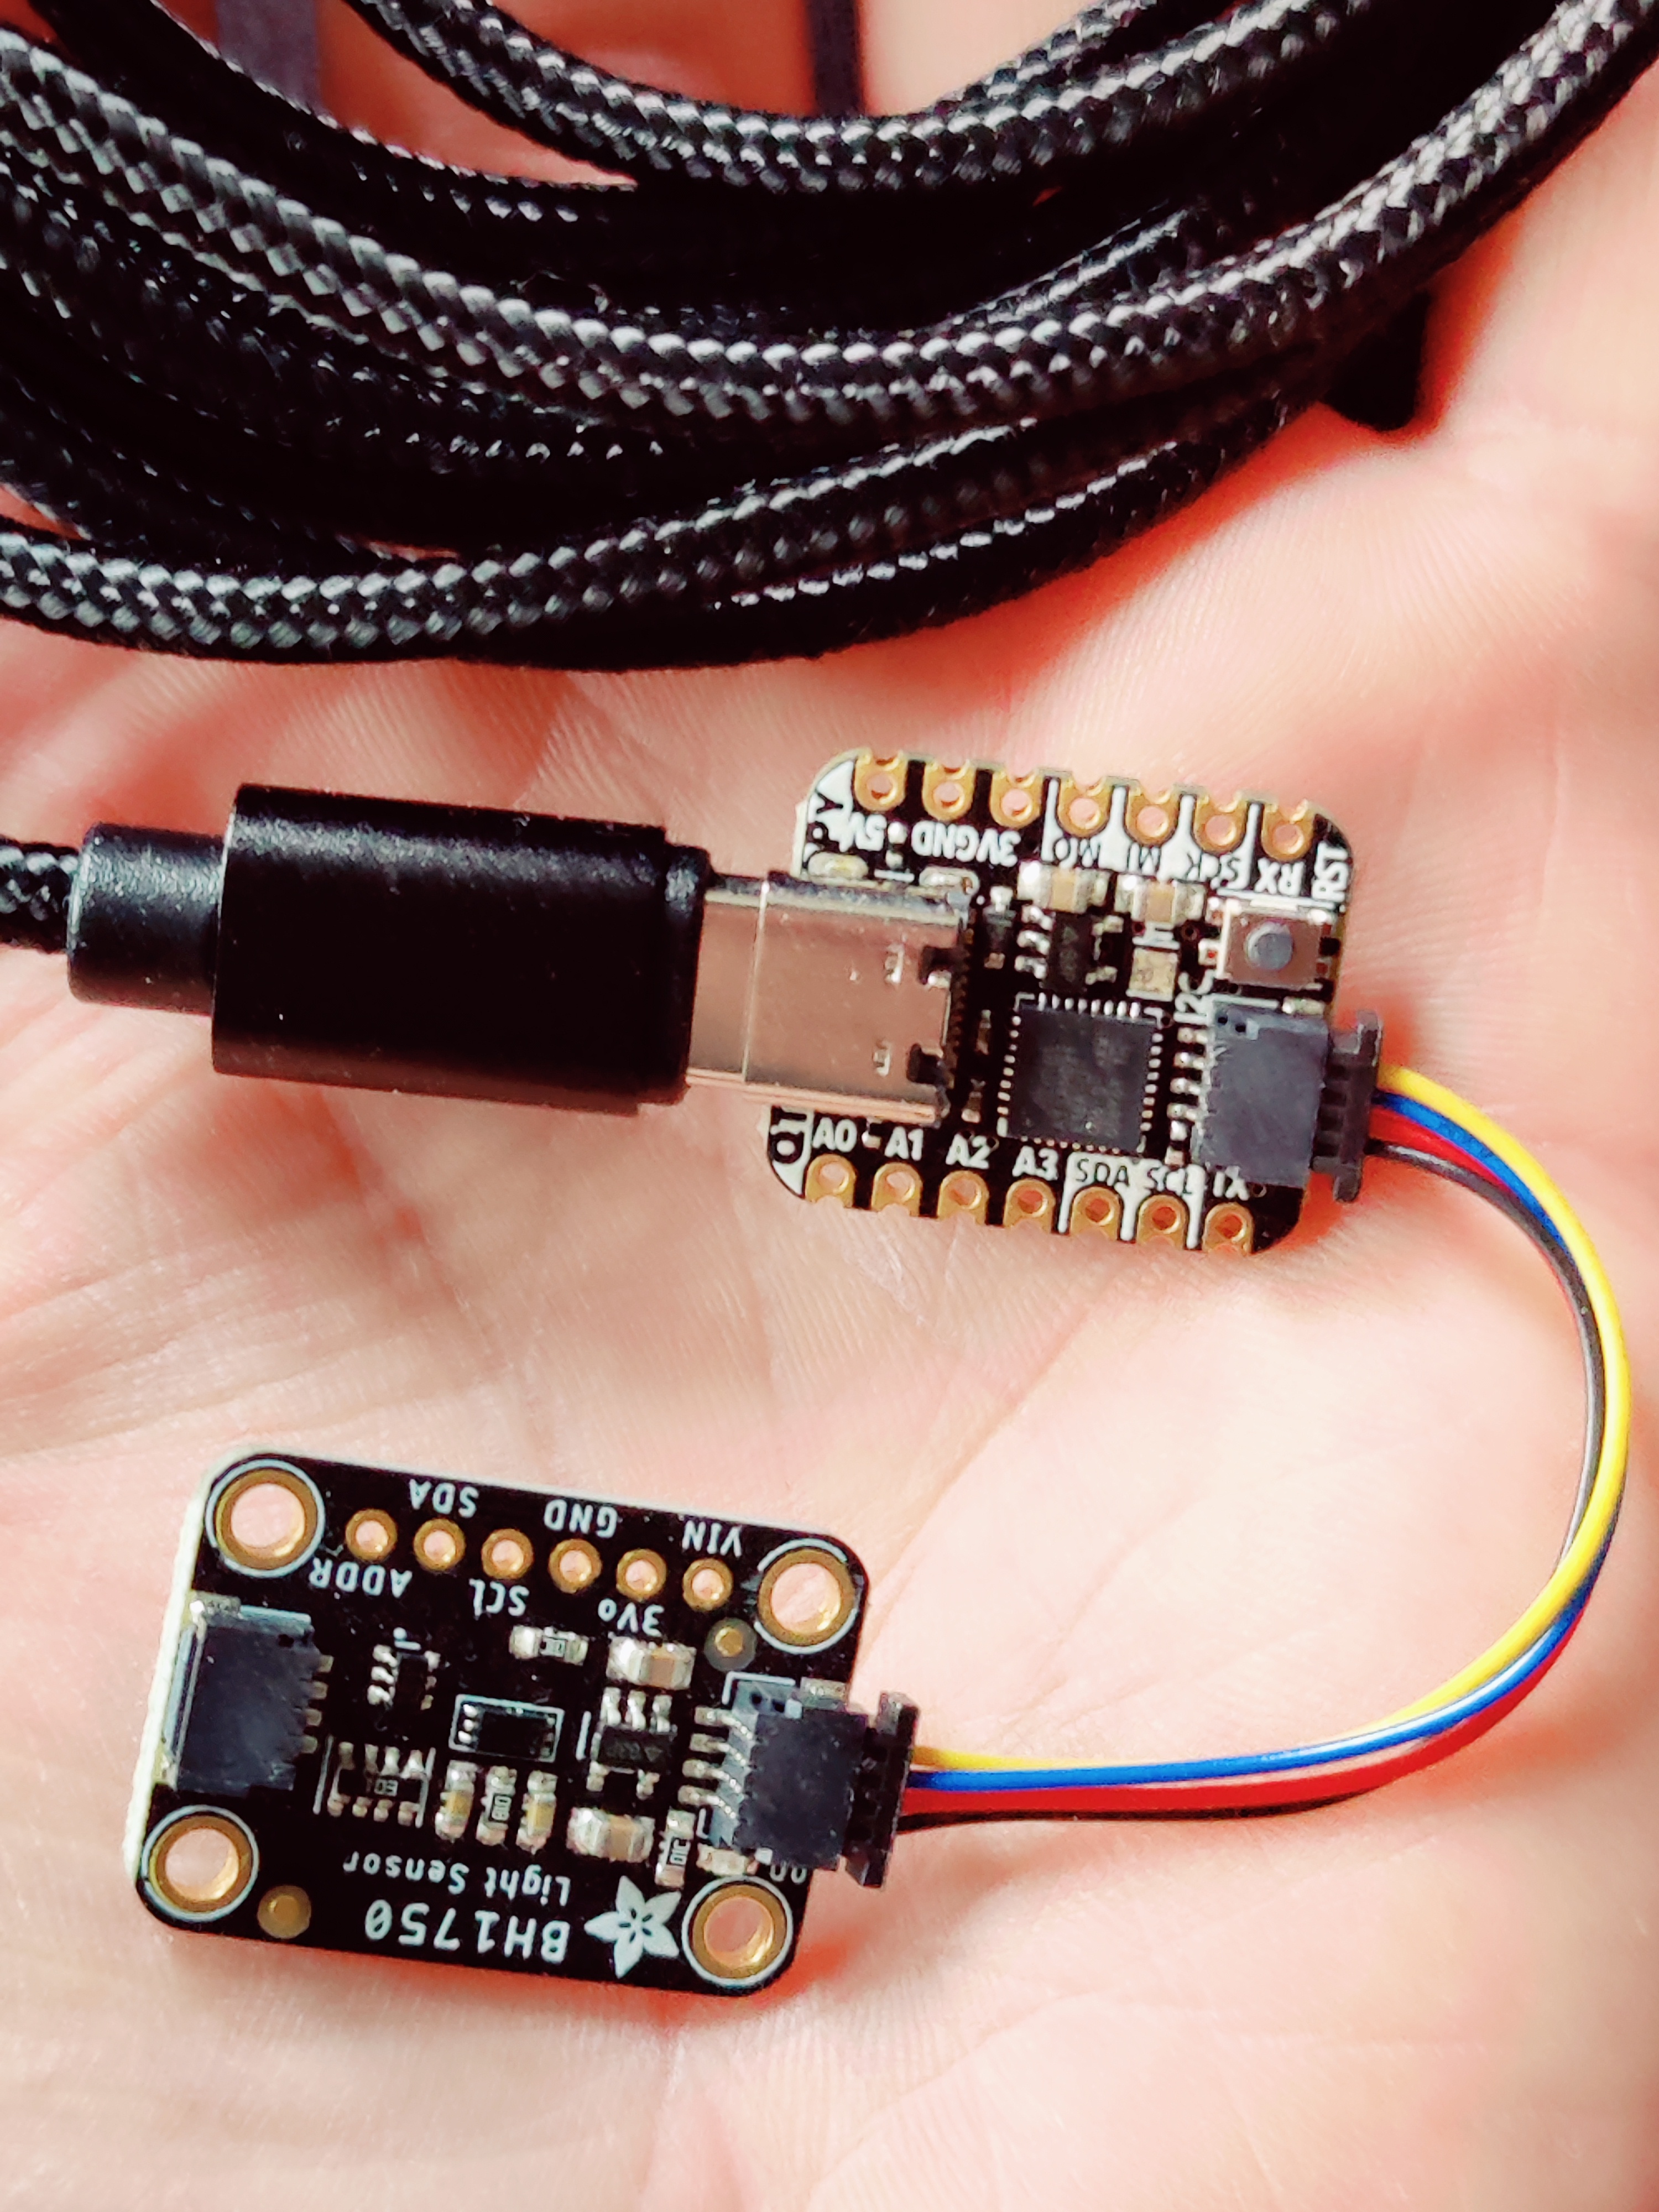
The main microcontroller component, the Adafruit QT Py microcontroller: The Adafruit QT Py is a compact and versatile microcontroller that supports CircuitPython, making it an ideal choice for this project. The QT Py features a built-in USB-C connector, which makes it easy to connect to a computer for programming and data transfer. More information on the Adafruit QT Py can be found on the Adafruit website: Adafruit QT Py
The light sensor selected is an Adafruit BH1750 Light Sensor: This sensor is used for detecting changes in luminance on the screen, such as a muzzle flash in a first-person shooter game. The BH1750 communicates with the QT Py via the I2C interface and is compatible with the Stemma QT cable for easy connectivity. Information about the light sensor can be found here: Adafruit QT Py
Stemma QT cable: This cable simplifies the connection between the QT Py and the light sensor, allowing for a plug-and-play experience.
(Optional) Adafruit APDS9960 Proximity, Light, RGB, and Gesture Sensor: As an alternative to the BH1750, the APDS9960 offers additional functionality, such as proximity sensing and gesture recognition. While not necessary for this project, it can add extra capabilities to your setup if desired.
DotStar LED: The onboard addressable LED on the QT Py will be used to provide visual feedback during the latency measurement process, including a countdown timer and an indicator for when the measurements are being taken.
Connect the QT Py microcontroller to the light sensor with the Stemma QT cable. Make sure the connectors are firmly inserted and the cable is not twisted.
Once you have connected the QT Py with the light sensor, the hardware setup is complete.
To protect the device it is recommended to design and to 3D print a housing for both components, however as I don’t personally have any experience with designing a casing and do not have a 3D printer to my disposal I have not explored that as of yet. There are several compatible designs available for the Adafruit QT Py on Thingiverse for example that could be adapted to include room for the light sensor and an opening for the sensor. One such example is the QT Py holder: QTPy holder by loretod, and one found on printables for the sensor: Adafruit BH1750 Case by Making with Matt
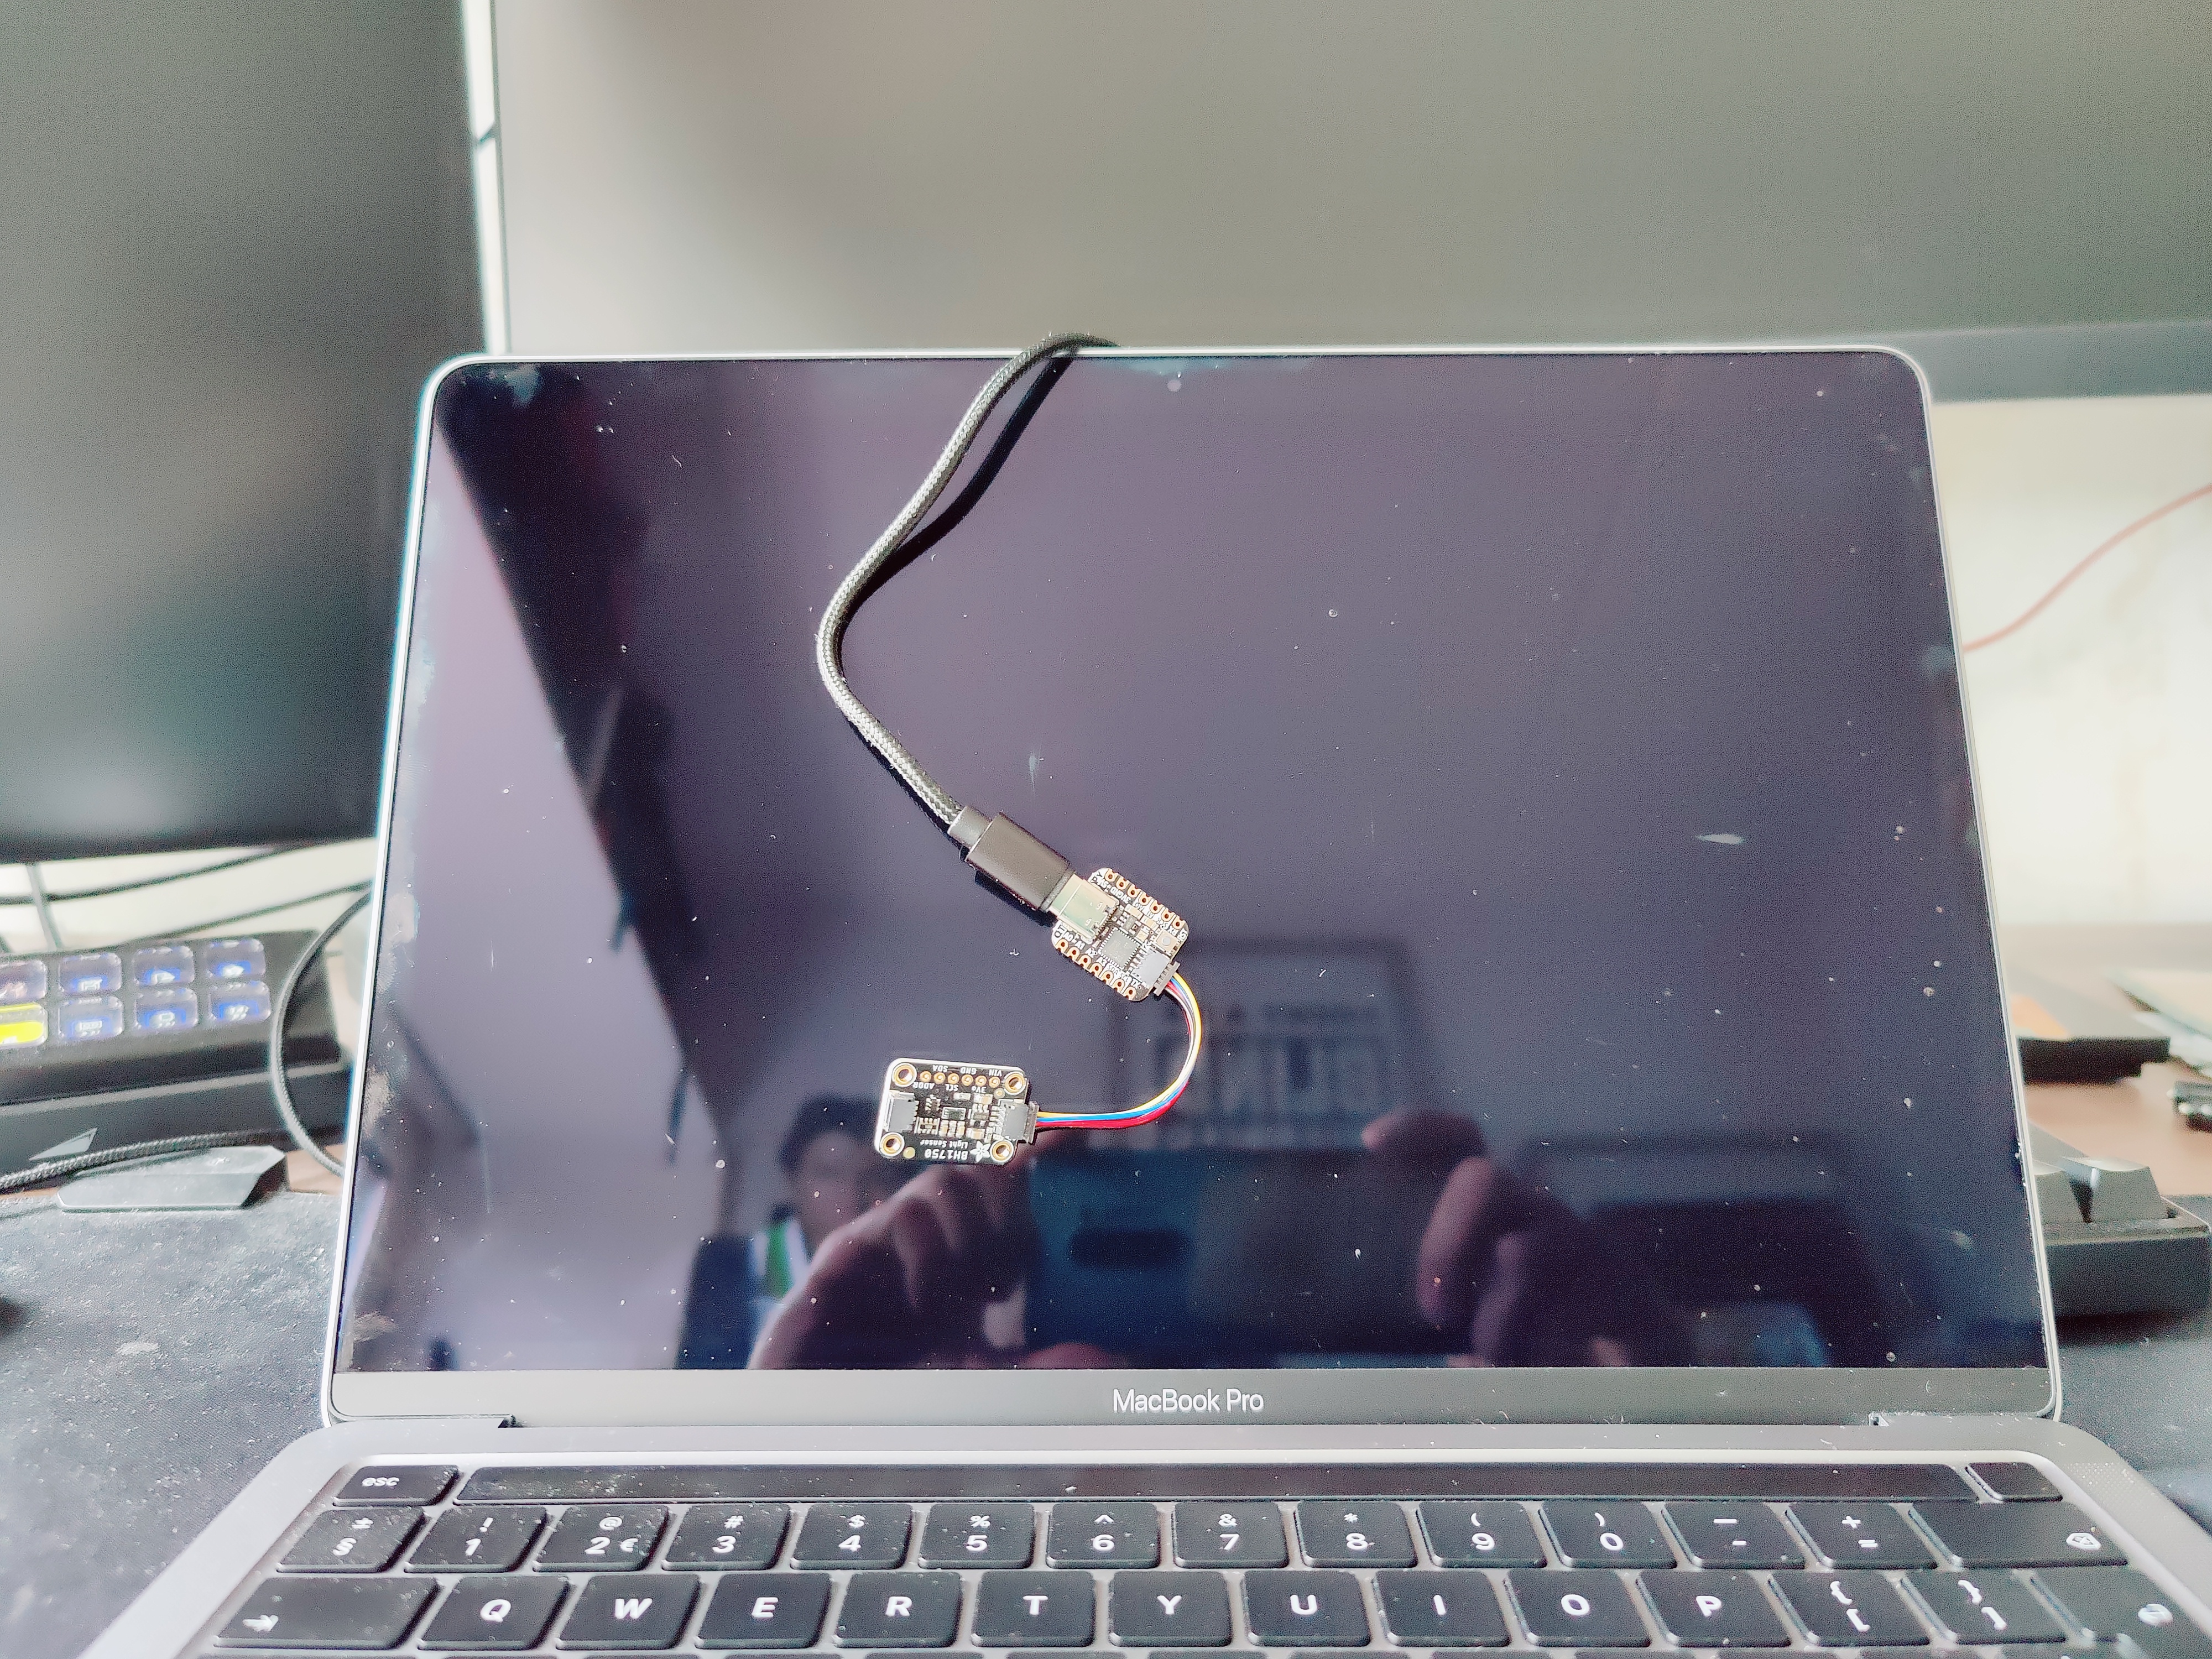
Similarly like with the NVIDIA LDAT, the microcontroller and sensor need to be attached to the monitor for optimal performance, for example with an elastic or rubber band to hold them in place. Please note that when used without a casing, the boards can easily scratch the monitor.
In addition to the hardware requirements there are several software requirements for this project.
Make sure to install the latest version of CircuitPython on the Adafruit QT Py. Please refer to the CircuitPython website for detailed instruction on how to install the latest version to the microcontroller.
For the BH1750 light sensor, the relevant Circuitpython library is required. The library can be downloaded from the Adafruit GitHub repository. Please refer to the GitHub page for detailed instructions on how to install and load the library.
Because the QT Py will also function as a Human Interface Device (HID) and act as a mouse or a keyboard in order to send mouse clicks, the Adafruit CircuitPython HID library is also required.
Lastly the adafruit_dotstar library is required to access the onboard addressable LED on the QT Py. Because the QT Py does not have a screen that can be used for information, the LEDs will be used for visual feedback during the latency measurement process, including a countdown timer and an indicator for when the measurements are being taken.
For the calibration process, Python will need to be installed on a Windows, MacOS or Linux device to create and run the calibration script. This script will show a series of alternating black and white patterns on the screen and will help to calibrate the latency measurements by determining the inherent latency of the QT Py and the light sensor.
The calibration routine uses the tkinter package. Tkinter is a standard Python interface to the Tcl/Tk GUI toolkit. Both Tk and tkinter are available on most Unix platforms, including macOS, as well as on Windows systems.
In this section, we’ll walk you through the process of implementing the latency measurement setup using the Adafruit QT Py, CircuitPython, and the BH1750 light sensor.
Start off with the first section to initialize the I2C bus and the BH1750 sensor, as well as the HID mouse and DotStar LED:
import time
import board
import busio
import adafruit_bh1750
from adafruit_hid.mouse import Mouse
from adafruit_hid.mouse_button import MouseButton
import adafruit_dotstar as dotstar

i2c = busio.I2C(board.SCL, board.SDA)
sensor = adafruit_bh1750.BH1750(i2c, mode=adafruit_bh1750.CONTINUOUS_HIGH_RES_MODE)
mouse = Mouse()
led = dotstar.DotStar(board.APA102_SCK, board.APA102_MOSI, 1, brightness=0.1)
The next section defines the parameters for the latency measurement test, such as the number of clicks, pause between clicks, and the threshold for detecting muzzle flash:
num_clicks = 10 # number of clicks or tests to perform
pause_between_clicks = 1  # In seconds
muzzle_flash_threshold = 1000  # Change this value based on the expected brightness of the muzzle flash
countdown_seconds = 5  # Configure the countdown duration in seconds
The function below continuously reads the light sensor’s output value and compares it to the defined threshold:
def detect_muzzle_flash():
    while True:
        light_level = sensor.lux
        if light_level >= muzzle_flash_threshold:
            return light_level
While the function is called detect_muzzle_flash() its naming doesn’t restrict it to only detect muzzle flashes in first person shooter-like applications, but can also detect a sudden change in luminous intensity in other applications.
Because the code on the QT Py will start immediately once the device is plugged in, a delay is factored in, together with a countdown timer by using the onboard LEDs:
for _ in range(countdown_seconds):
    led[0] = (255, 0, 0)
    led.show()
    time.sleep(0.5)
    led[0] = (0, 0, 0)
    led.show()
    time.sleep(0.5)

led[0] = (0, 255, 0)
led.show()
Next up is the main loop with all of the logic. The main loop sends the mouse clicks, detects muzzle flashes, calculates latency, and saves the results to a timestamped CSV file on the QT Py’s internal storage:
from datetime import datetime

timestamp = datetime.now().strftime("%Y%m%d-%H%M%S")
filename = f"/CIRCUITPY/latency_{timestamp}.csv"

with open(filename, "w") as f:
    f.write("click_number,latency_ms\n")

for i in range(num_clicks):
    mouse.click(MouseButton.LEFT)
    click_time = time.monotonic()
    detect_muzzle_flash()
    flash_time = time.monotonic()
    latency = (flash_time - click_time) * 1000

    with open(filename, "a") as f:
        f.write(f"{i + 1},{latency:.2f}\n")

    time.sleep(pause_between_clicks)

led[0] = (0, 0, 0)
led.show()
This is all the code you need for the basic setup of the latency measurements.
In order to make sure that the results are calibrated in this section a basic calibration process is defined.
To make sure that the latency measurements are accurate, it is essential to perform at least a basic calibration process. This calibration serves as a way to determine the inherent latency of the QT Py and the light sensor for example, helping to account for any delays introduced by these components. However, it is important to note that this is only a very basic form of calibration and might not account for all possible sources of latency or variations in latency.
The first part of the calibration is to create a Python script to display alternating black and white patterns on a local Windows device. The patterns should change at a strict time frame, allowing the QT Py and light sensor to measure the time between the patterns.
import tkinter as tk
import time

def alternate_colors():
    current_color = 'white'
    while True:
        canvas.config(bg=current_color)
        root.update()
        time.sleep(0.5)
        current_color = 'black' if current_color == 'white' else 'white'

root = tk.Tk()
root.attributes('-fullscreen', True)
canvas = tk.Canvas(root, bg='white')
canvas.pack(fill=tk.BOTH, expand=True)

root.after(1000, alternate_colors)
root.mainloop()
Next up is the calibration routine for the QT py:
import time
import board
import busio
from adafruit_bh1750 import BH1750
import adafruit_sdcard
import storage

# Initialize the BH1750 light sensor
i2c = busio.I2C(board.SCL, board.SDA)
light_sensor = BH1750(i2c)

def detect_light_change(threshold=50):
    prev_light_level = light_sensor.read_lux()
    while True:
        current_light_level = light_sensor.read_lux()
        change = abs(current_light_level - prev_light_level)

        if change >= threshold:
            break

        prev_light_level = current_light_level
        time.sleep(0.01)

def calibration_measurements(num_measurements, pattern_interval):
    calibration_data = []

    for i in range(num_measurements):
        # Wait for the pattern change event
        time.sleep(pattern_interval)

        # Record the time of the pattern change event
        event_time = time.monotonic()

        # Wait for the sensor to detect the light change
        detect_light_change()

        # Record the time of the detected light change
        light_change_time = time.monotonic()

        # Calculate the latency
        latency = (light_change_time - event_time) * 1000  # Convert to milliseconds

        # Add the latency value to the calibration_data list
        calibration_data.append(latency)

    return calibration_data

def save_calibration_data(calibration_data, file_name="calibration.txt"):
    with open(file_name, "w") as f:
        for latency in calibration_data:
            f.write(f"{latency}\n")

# Perform calibration measurements
num_calibration_measurements = 10
pattern_interval = 1  # Change this to match the interval of the black and white pattern
calibration_data = calibration_measurements(num_calibration_measurements, pattern_interval)

# Save the calibration data to a file
save_calibration_data(calibration_data)
This code includes detect_light_change(), calibration_measurements(), and save_calibration_data() functions. The calibration_measurements() function takes the number of calibration measurements and the pattern interval as inputs and returns a list of calibration latency values. The save_calibration_data() function takes the list of calibration latency values and saves them to a file called “calibration.txt” on the QT Py device storage. If the file already exists, it will be overwritten with the new calibration data.
Make sure to adjust the pattern_interval variable to match the interval of the black and white pattern you’re using for calibration.
To incorporate the calibration in the latency measurements, the calibration values are read from “calibration.txt” file present on the QT py’s internal storage.
The calibration code below should be added before the main loop to measure the latency of the system itself. First, check if the calibration.txt file exists. If it does, read the calibration value and use it to adjust the latency measurements. If it doesn’t exist, run the setup uncalibrated.
import os

avg_calibration_latency = 0

if "calibration.txt" in os.listdir("/CIRCUITPY"):
    with open("/CIRCUITPY/calibration.txt", "r") as f:
        avg_calibration_latency = float(f.read().strip()
The main loop can be adjusted as following:
for i in range(num_clicks):
    mouse.click(MouseButton.LEFT)
    click_time = time.monotonic()
    detect_muzzle_flash()
    flash_time = time.monotonic()
    latency = (flash_time - click_time) * 1000
    adjusted_latency = latency - avg_calibration_latency

    with open(filename, "a") as f:
        f.write(f"{i + 1},{adjusted_latency:.2f}\n")

    time.sleep(pause_between_clicks)
To analyze the data, review the latency values recorded in the timestamped CSV file on the QT Py’s internal storage. These values represent the time it takes for the muzzle flash to appear on the screen after a mouse click. Lower latency values indicate a more responsive system, while higher values may suggest areas for improvement.
It is important to analyze both the calibrated and uncalibrated latency measurements to understand the impact of the inherent latency of the QT Py and the light sensor. Calibrated measurements account for this inherent latency and provide a more accurate representation of the true end-to-end latency.
The CSV file can be copied from the QT py’s internal storage to a Windows device and imported into Excel or to a dedicated data analysis tool, to create graphs or to perform more detailed data analysis, such as determining the averages, the standard deviation etc in order to better interpret the data. For more information on statistical analysis, please refer to this post here: Stuck in the middle, an introduction into statistical analysis for GO-EUC
This article detailed a basic solution for measuring end-to-end latency, as a cheap alternative to the NVIDIA LDAT tool.
Please note that this is only a basic setup and there is always room for improvement and further customization. By experimenting with different sensors, refining the calibration process, and adjusting the code to suit specific requirements, you can create a setup tailored to your unique needs. The optional Adafruit APDS9960 Proximity, Light, RGB, and Gesture Sensor for example adds additional functionality, such as proximity sensing that can be used to determine if the sensor is indeed attached to the screen properly. It can also be used to read RGB values instead of just the light intensity.
Photo by Vishnu Mohanan on Unsplash

Echteld, Netherlands

Malta