


Evaluating the Performance Impact of Microsoft AppLocker


Due to global pandemic, working from home has become a stable part of our new daily routines, and the VDI has become a more important commodity as a result.
Nowadays the workloads are increasing with GPU-compatible applications in both regular Office, and knowledge worker workloads. Sizing a GPU-enabled environment is primarily determined by the framebuffer available in the physical GPU. But then the question arises, how does Windows go about in the usage of the available framebuffer memory? This research will deep dive into the framebuffer sizes and usage in a Windows 10 VDI scenario.
Let’s first start with explaining what the framebuffer is before going into the results. A framebuffer, also referred to as the framestore, is a portion of random-access memory (RAM) on the graphics card (or GPU), containing a bitmap that drives a video display. It acts as a memory buffer and contains the data representing all the pixels in a complete video frame. Modern video cards contain framebuffer circuitry in their cores. This circuitry converts an in-memory bitmap into a video signal that can be displayed on a computer monitor.
Source: Framebuffer - Wikipedia
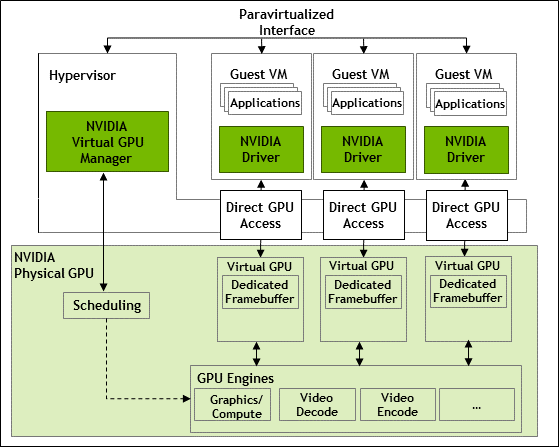
When virtualizing the desktop, the physical GPU is stored in the server and can be directly attached to a virtual machine using passthrough, or divided over (and there for shared among) multiple virtual machines. In VDI environments it is common practice to divide the GPU, but how the division is done is depenent on the (projected) workloads. The GPU compute resources will be shared as well as the GPU memory and will be evenly divided amongst the machines. This means the primary limitation is the available GPU memory on the physical card. NVIDIA provides multiple profiles for various use-cases and license types. More information on this can be found at NVIDIA.
In terms of best practices, the following recommendation is made by NVIDIA:
A good rule of thumb to follow is that framebuffer utilization should not exceed 90% for a short time or an average of over 70% on the 1 GB (1B) profile. If high utilization is noted, then the vPC VM should be assigned a 2 GB (2B) profile. These results are reflective of the work profile mentioned in Section 1.1. Due to users using application in different ways we recommend performing your own POC with your workload.
Source: Application-Sizing-Guide-NVIDIA-GRID-Virtual-PC.pdf
As explained above, multiple factors will influence the framebuffer size, but how is Windows utilizing the framebuffer when the framebuffer size is increased and therefore more framebuffer is available to Windows.
This research has taken place on the GO-EUC platform, which is described here. The default operating system is Windows 10 21H1 delivered using Citrix Virtual Apps and Desktops. This research is not focused on density, like most studies, but on the implications of various framebuffer sizes. To ensure all the results can be compared, the maximum virtual machine density is configured, based on the largest framebuffer configuration. The host has 4 NVIDIA Tesla T4 cards, each with 16GB of memory available, summing up to 64GB in total. That means that in this case, all tests are done using 16 VMs. The amount of VM’s is based on 16 multiplied by 4GB which is equal to 64GB memory, the maximum capacity of the NVIDIA GPU’s available on the host. Using 4GB as the maximum will be determined that the 4Q profile will be used as the max.
Because the driver version could also have an impact on the test results, it is worth mentioning that the driver version used was version 13.0, the latest version available at the time of testing.
This research will use two primary data sources, Remote Display Analyzer, which provides the data from an individual user (session charts), and ESXtop data including NVIDIA SMI to provide the perspective from the hypervisor (host charts).
The NVIDIA System Management Interface (nvidia-smi) is a command-line utility that is used to collect the NVIDIA performance data from the host perspective. More information about NVIDIA SMI can be found here.
The following framebuffer sizes are included in this research:
All scenarios are configured with a 1920x1080 resolution and a single display. The only configuration that is changed between each scenario is the framebuffer size. The recommended Citrix policies are used, which are described here.
This research is executed using the GO-EUC testing methodology, which is described here. Except for the workload running time as this is extended to a total of 90 minutes. This will ensure, that at least one cycle of the workload is completed for each individual simulated user.
The default GO-EUC knowledge worker workload is used for two reasons: first and foremost to see the effect of the framebuffer usage in a regular workload. Secondly, it is not intended to fully utilize the GPU as this will have a negative effect on the framebuffer usage. The GO-EUC knowledge worker workload is a productivity workload using Microsoft Office, web-based content, and videos. This workload does not include any heavy GPU applications.
At GO-EUC there was a debate on how the framebuffer is behaving when the size is increased. Some of us expected to see the same results whereas others instead were of the opinion that Windows would most likely claim more of the framebuffer. So, beforehand there was no clear consensus on the expected outcome.
It is expected to see a minimal to no difference in the session FPS as the workload is neither CPU nor GPU heavy. As the Frames per Second is a highly sensitive metric a difference of 5% will not be noticeable and is most likely caused by randomization in the workload. It is important to ensure the overall pattern is similar, which is the case for this dataset.
What’s more, the session GPU usage confirms a single user is not maximizing the GPU capabilities, and therefore should not impact the framebuffer usage. The comparison chart shows the maximum session GPU.
The various framebuffer charts above, show the session GPU framebuffer usages in both MB’s and percentage. These values are the absolute values. In terms of framebuffer usage, there are two important factors to take into account. First, it is important to look at the average usage of the workload, which should be around 70% framebuffer usage according to the NVIDIA recommendation. Secondly, it is expected to get higher peak performance, but those should not exceed 90% for a short time.
It is important to consider that framebuffer usage is very dependent on the workload. In the case of GO-EUC testing, it does show a higher framebuffer is consumed by Windows when there is more available. As with a larger framebuffer Windows can leave more in memory compared to the other scenarios, resulting in a higher overall framebuffer usage.
Worth mentioning is that there is no clear definition of what the ‘short time is’ that NVIDIA mentions in their documentation.
The data shown for the 1Q profile has a peak usage of 98% (1003MB) for three minutes, but is that a short time? On average the 1Q profile is spot on, showing an average usage of 68% (712MB).
As the workload is the same between the different profiles, it is expected to see a similar pattern in the GPU utilization from a host perspective.
The overall GPU utilization for this research is low, as only 16 users are simulated on the host. The overall pattern looks very consistent showing an increasing GPU utilization caused by adding more simulated users over the first 60 minutes. There is a noticeable difference in the last 30 minutes which is caused by the workload randomization.
The host GPU memory utilization is the same as the host GPU utilization. As the overall usage is very low, this difference won’t be directly noticeable on this scale. However, this might be different when the load is increasing.
Now from a host CPU perspective, it is expected to see no difference between the scenarios.
The main difference is due to the start of the workload, which is caused by the short idle time for this scenario. The pattern is spot on after 15 minutes and is overall very low.
When using the GO-EUC knowledge worker workload, which is relatively light in terms of multimedia content, using a single monitor with a resolution of 1920x080, using a 1Q profile (1GB) is the sweet spot of optimal density and performance.
In the case of the GO-EUC configuration, this means using a 1Q profile it is possible to facilitate 16 users per GPU with a maximum capacity of 64 users based on the 4 Tesla T4 cards, without penalties or issues to the user experience.
The size of the recommended framebuffer is depending on various factors. The number of displays, applications, overall workload, resolution, protocol configurations, etc. From the NVIDIA sizing guide, it is recommended to not exceed the 90% framebuffer in a constant factor and should be aimed at an average of 70% framebuffer.
This research shows Windows 10 will consume more of the framebuffer when there is more capacity available while delivering the same user experience. This is most likely caused by the amount of memory active in the framebuffer as there is more room available when using a larger framebuffer size.
Now, this might not have a direct impact in a VDI context, but in an RDS scenario, where the GPU resources are shared over multiple users this might have a bigger impact. What do you think, should we investigate the framebuffer usage in an RDS context? Let us know in the comments below.
This research shows it is important to validate the framebuffer usage in your context to ensure the optimal size. Please take into account to measure both average and maximum usage.
Do you see an increase in framebuffer usages over the last years? Please share your experience in the comments below or share it at the World of EUC Slack channel.
Photo by Karlis Reimanis on Unsplash

Nieuwegein, Netherlands

Oslo, Norway

Malta