


Evaluating the Performance Impact of Microsoft AppLocker


Due to their technical nature, remoting protocols like Citrix HDX can potentially result in image degradation for the end-user which, in turn, can cause a lowered user experience if the remoting protocol is configurated incorrectly. For task worker-like workloads this might not be an immediate issue, however, in practice, most end-users will be able to notice these degradations. In other workloads where image quality is of higher importance, balancing image quality on the one hand and performance, on the other hand, can prove to be a difficult effort.
On 14 December 2021 Citrix released version 7 2112 of the Virtual Apps and Desktops software in the current release channel. This release promises to introduce significant enhancements and innovations to improve graphics (3D Pro) workload performance. This research will take a closer look into the 3D improvements of this release.
The release notes mention the following graphics related improvements:
HDX graphics improvements
Source: Citrix Virtual Apps and Desktops 7 2112
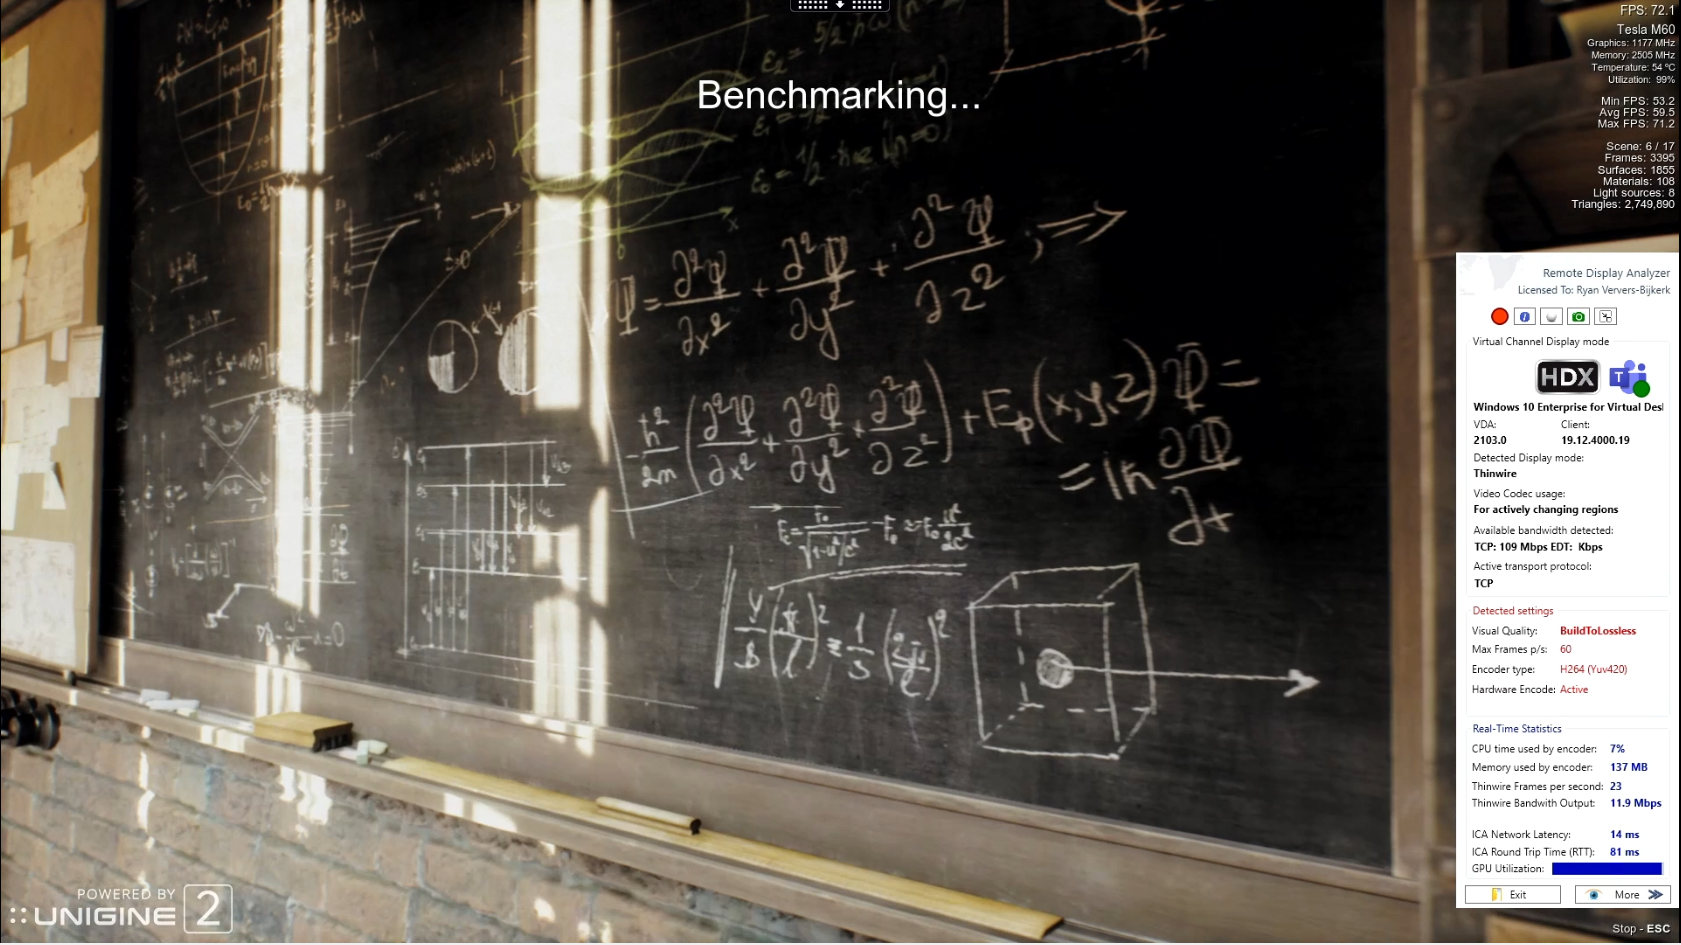
According to the release notes Citrix is stating the improvement mentioned above. Based on previous researches and customer use-cases we can be confirmed a limitation in the protocol FPS is quick to reach when using GPU benchmark or high-end graphics applications. This is visible as the rendered FPS on the VM is higher compared to the delivered FPS shown in the example screenshot below.
Thanks to NVIDIA for sponsoring GO-EUC and providing the platform with the GPU capabilities necessary for testing the 3D pro capabilities and enhancements. NVIDIA kindly sent us four T4 cards and one M10 card as described in the infrastructure description.
Contrary to the regular researches, this research is mainly focused on graphics performance and capabilities and as such, the research is conducted slightly differently than normal.
The graphic performance was compared using the traditional data metrics on the VDA captured using the Windows Performance Monitor, CPU-Z, and Remote Display Analyzer.
For the research, the “3D workload best practices” as described in the Techzone Design Decision: HDX Graphics overview article were used with some small deviations:
| Policy | Value |
|---|---|
| Video Codec | For the entire screen* |
| User hardware encoding for video codec | Enabled (where available) |
| Visual Quality | High* |
| Target Framerate | 60 |
| Target minimum Framerate | 10 |
| HDX Adapative transport | Off |
| Hardware Acceleration or graphics | Enabled |
| H265 Decoding for Graphics | Enabled** |
| Optimize for 3D graphics workload | Enabled |
* Deviation from the best practices listed in the article ** H265 decoding was not available for the used hardware graphics cards ** Important note on the H265 requires Citrix Premium licensing and supported hardware on both server and endpoint side. The most common is to use H264, as this covers most use-cases.
On the VDA, the graphics quality slider was left at default, with “let the system decide” selected and “Pixel Perfect” off.
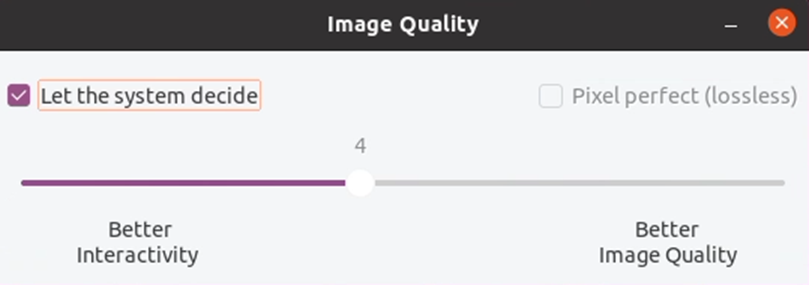 With the default setting the image quality is selected based on available bandwidth ensuring that the set target framerate can be met. Additionally, the NVIDIA frame limiter has been disabled on the virtual machine so this is not limited to 60FPS rendering in the benchmark. This way the max FPS will be protocol limited.
Additionally, for this research, an Image Quality Assessment (IQA) was also used in the comparisons. For the IQA the image quality degradation was calculated and compared to reference or baseline images taken from recordings of the runs, effectively using a Full-Reference (FR) approach. The recordings of the runs were made using an Elgato HD60s hardware capture card. The videos were captured using a fixed 60FPS framerate, an HD resolution, and a Constant Bitrate (CBR) using OBS Studio. This resulted in a video file with the following specifications:
| Property | Value |
|---|---|
| Video Codec | H264 – MPEG-4 AVC (part 10) (avc1) |
| Video Resolution | 1920x1080 |
| Total Bitrate | 25000Kbps |
| Frame rate | 60 |
| Audio Codec | MGPEG AAC Audio (mp4a) |
| Sample rate | 48000Hz |
| Bits per sample | 32 |
For the IQA, three metrics were used:
The Mean Squared Error (MSE), one of the most commonly FR metrics is calculated and this estimates the absolute errors (or image quality reduction) compared to the reference image. For MSE, values closer to zero are the better. The MSE is calculated by the squared intensity differences of the tested and baseline image pixels and averaging them with the peak signal-to-noise ratio (PSNR).
PSNR or Peak Signal-to-Noise Ratio is used to calculate the ratio between the maximum possible signal power and the power of the distorting noise which affects the quality of its representation.
When comparing compression codecs, for example, PSNR is an approximation to human perception of reconstruction quality.
Typical values for the PSNR in lossy image compression lie between 30 and 50 dB when the bit depth is 8 bits, where higher is better.
If two images are identical, the MSE is zero and the PSNR is infinite or undefined (division by zero).
Both MSE and PSNR, however, estimate the absolute errors and therefore do not correlate very precisely with the perceived image quality. By definition, PSNR is nothing more than a normalized version of the MSE.
To measure the perceived image similarity between two images SSIM or Structural Similarity Index Measure is used. While also an FR approach, SSIM however is a perception-based model that considers image degradation as perceived change in structural information, while also incorporating luminance masking and contrast masking in its calculation.
In order to evaluate the image quality, the SSIM calculation is applied only on luma and therefore both images are first converted to grayscale using a color space conversion using COLOR_RGB2GRAY, effectively creating images with only one color channel.
The SSIM value is a decimal value between 0 and 1, with values closer to 1 meaning a more similar image compared to the baseline image. Comparing two identical images will result in an SSIM value of 1.
SSIM is comparatively better than MSE and PSNR metrics from a human visual perspective as it is a perceived image quality similarity. Without going into details, a higher SSIM demonstrates a closer resemblance to the baseline or reference image. Note that there is always a margin of error due to the moving images and the 60 FPS framerate and therefore multiple captures were taken and the best result (the highest SSIM value) was selected for the comparison.
Both the baseline and the referenced images were then cropped and used for analysis. Keep in mind that the cropped images shown are for reference only and displayed in a compressed format and therefore not the actual images that were used in the comparisons. The actual image comparison was done using OpenCV 4.5.4 and scikit-image version 0.18.1, where both images are represented by a Numpy array and consequently compression is not a factor in the comparison.
Snapshots used for the IQA were taken manually using VLC media player. All settings are left default with the exception of deinterlacing in VLC which was disabled.
For this research the following three scenarios are used:
| Component | Type |
|---|---|
| CPU | AMD Ryzen 7 5800X |
| GPU | NVIDIA RTX 3070Ti |
| Memory | 16GB Memory |
| Storage | 2x 1TB NMVE |
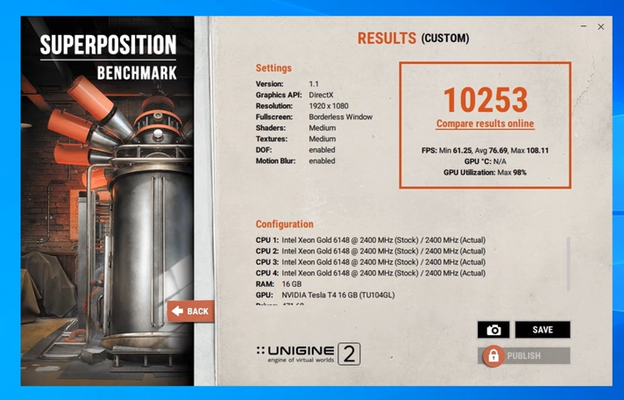
This dedicated system is used as the baseline, running with a fixed FPS of 60, which in terms resulted in a fixed score in the Superposition Benchmark.
For each build tested, three runs were done and for the final analysis, the best run for each build was selected. The best run was selected based on the end score of the Superposition Benchmark. The data used for the analysis aren’t tied to that specific run and therefore the data used is based on the averages as normal.
To experience the difference, we made the videos available on YouTube. Please take into account YouTube applies additional compression on the video which might affect the overall quality.
In order to have a fair comparison, the baseline has been removed from the data analysis, as this is only used for the video and image quality analysis.
Overall the CPU pattern is almost similar between both 2109 and 2112, where 2112 is slightly lower.
There is one important note, the second run of the CVAD 2109 contains a spike in CPU usage which is clearly visible in the data on the 01:45 mark even in the average comparison. This of course has a negative effect on the average score because in this research ‘only’ three runs were used.
The CPU results are in line with the mentioned reduction of CPU consumption from the Citrix release notes. While this research used an HD resolution, it is expected to see even bigger improvements when using multiple screens or 4K resolutions.
Due to the nature of the Superposition benchmark, the GPU is fully utilized that shows in both scenarios the GPU performance is the primary bottleneck on the server (read: VDA) side. Please note that the GPU Utilization shown in the graph is the absolute GPU usage.
In the case of the GPU memory, as a 16Q profile is assigned no limitations are reached as only 27% of the total capacity is used. This means the sizing of the frame buffer is well within the NVIDIA sizing recommendations.
This is the most important metric to showcase the improvements made by Citrix in the new release. The FPS shows a 45% increase in the number of frames sends to the endpoint. Please note the maximum number of frames is limited to 60FPS based on the Citrix policy recommendations.
It is clearly visible CVAD 2109 is not capable to deliver a constant amount of FPS while the VM side is still rendering more frames in the benchmark. This proves there is a limitation or cap in the protocol present in versions up to 2109, which is resolved in CVAD 2112.
There is a direct correlation between the FPS count and the bandwidth output: when sending more frames to the endpoint this does have a direct effect on the bandwidth output as seen in the CVAD 2112 results. This is therefore important to consider when running in a bandwidth-limited scenarios because this could result in a quality degradation when leaving the Quality Slider on the option “Let the system decide”.
| Baseline | CVAD 2109 | CVAD 2112 |
|---|---|---|
 |
 |
 |
| CVAD 2109 | CVAD 2112 | |
|---|---|---|
| MSE | 159.01 | 119.1 |
| PSNR | 26.03dB | 27.32dB |
| SSIM | 0.9315 | 0.9458 |
MSE = Lower is better; PSNR = Higher is better; SSIM = Higher is better.
Image quality degradation is present for both CVAD 2109 and 2112 as depicted in the MSE, PSNR, and SSIM metrics, however, the visual image degradation is less apparent with CVAD 2112.
| Baseline | CVAD 2109 | CVAD 2112 |
|---|---|---|
 |
 |
 |
| 2109 | 2112 | |
|---|---|---|
| MSE | 19.74 | 22.4 |
| PSNR | 34.23dB | 34.21dB |
| SSIM | 0.9571 | 0.9570 |
MSE = Lower is better; PSNR = Higher is better; SSIM = Higher is better.
For scene 2 the perceived visual quality is near indistinguishable between CVAD 2109 and 2112; the SSIM values are almost identical.
| Baseline | CVAD 2109 | CVAD 2112 |
|---|---|---|
 |
 |
 |
| CVAD 2109 | CVAD 2112 | |
|---|---|---|
| MSE | 11.07 | 7.96 |
| PSNR | 36.57dB | 38.11dB |
| SSIM | 0.9573 | 0.9688 |
MSE = Lower is better; PSNR = Higher is better; SSIM = Higher is better.
For graphics-related workloads in 3D-Pro use cases, in release 2112 Citrix has made impressive improvements compared to the previous releases. No denying Citrix has outdone themselves with this release and delivered on their HDX graphics improvements.
In our frame of reference, there were almost no frame drops measured, and sustained throughput of the set target framerate of 60fps was exhibited throughout all three tested runs.
Please note as far as we can tell, these improvements are tied to NVIDIA GPU-related systems.
In terms of image quality data collected with the IQA, release 2112 also showed improvements in terms of absolute quality as well as in perceived quality.
Please note that this is the first research where IQA was incorporated in the data and analysis. We are currently looking into how we can leverage the IQA in future researches. In this research, the frames were manually extracted using VLC, in future comparisons the aim is to automate this process for reproducibility and accuracy. We are committed to continually investing time and effort to produce innovations in our researches.
Please let us know if you value the new IQA approach and let us know how we can improve on this on the Slack channel.

Echteld, Netherlands

Malta