


Azure VDI Storage Benchmark: Premium SSD vs Standard SSD Performance and Cost Breakdown


Performance is a very important factor of the success of a virtual desktop environment. Since the release of Windows 10 and Windows Server 2016, Microsoft implemented memory compression, which is by default disabled on the server operating systems, but enabled on Windows 10. But is there any performance value when enabling memory compression, or does it come with a performance penalty? This research will take a closer look and will show the real value of memory compression in a Citrix Virtual Apps scenario.
It is important to start with a correct understanding of memory compression. Woshub.com shared an excellent description of memory compression.
The compressed memory feature is designed to improve the performance (responsiveness) of the system due to storing part of the memory pages in RAM in a compressed form. It helps to reduce the number of read / write requests to the memory pages in the slow (compared to RAM) paging file on a hard drive. The required data are extracted from the RAM faster even though additional CPU resources are spent to compress/decompress them.
To get all the details it is really recommend reading the full article, which can be found here.
Memory compression was introduced in Windows 10 1507 and Windows Server 2016. Since the introduction memory compression was running on the background but became a separate process since Windows 1607. The memory compression process is hidden from the task manager but visible for both PowerShell and Process Explorer.
Memory compression is disabled by default on the Server operating system and can be enabled by running the following PowerShell command “Enable-MMagent -MemoryCompression”. The command “Get-MMagent” will retrieve the current configuration, which can be used to validate if memory compression is running.
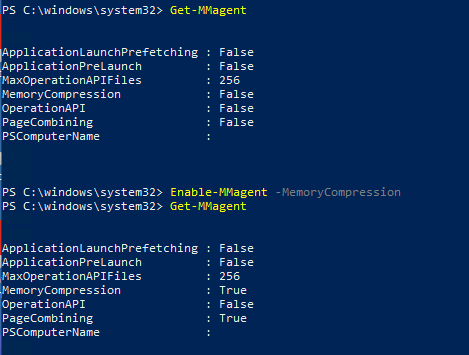
An important note, as shown in the screenshot, when enabling memory compression, page combining is also automatically enabled.
Page combining may help reduce memory usage on servers which have a lot of private, pageable pages with identical contents (which is likely to occur on multisession hosts). Page combining causes the memory manager to periodically combine pages in physical memory that have identical content. The tradeoff for page combining comes in the form of increased CPU usage and this may have a negative effect on the scalability and or performance.
Please note that page combining can be disabled independently from memory compression. For this research the default behavior of enabling memory compression is tested, so both settings were enabled.
Although the dedicated process is not visible in the task manager, it is possible to see the portion of memory that has been compressed. This can be done in the memory section on the performance tab.
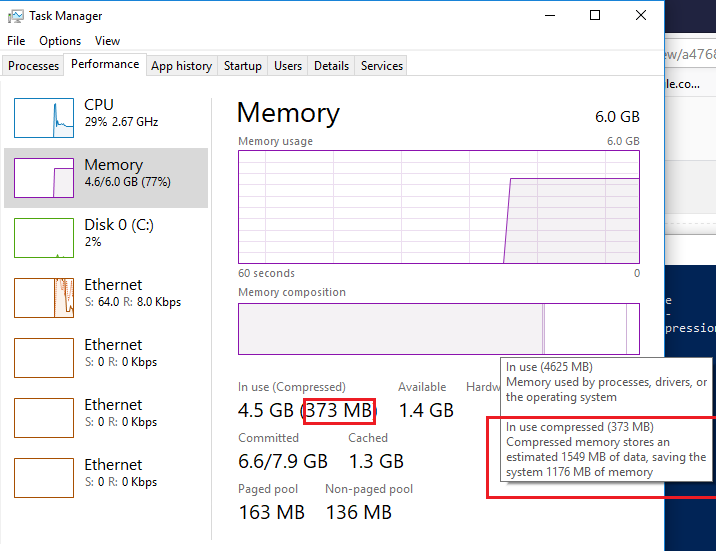
This example is captured on a Windows 10 machine and shows it compressed 373MB on memory. In a shared user environment, it is expected a decent amount of memory can be compressed and/or to see many pages being combined, especially when user share the same type of workload.
The research has taken place in the GO-EUC lab environment which is described here. The desktops are delivered using Citrix Virtual Apps and Desktops using MCS running with the Citrix VDA version 1912 and Microsoft Server 2016. The VM is configured with 8vCPU, 20GB memory, and a 64GB disk.
The page file settings on the VDAs were left as per default. This means that the page file is system-managed and can increase of decrease in size automatically by Windows. The maximum page file size is 3 x RAM or 4GB, whichever is the largest amount. More information on the page file can be found here.
In order to test the benefit of memory compression, the following scenarios are executed:
Memory compression enabled*
Each scenario is tested using the default testing methodology which is described in detail here. As it is a best practice, each deployment is fully updated and optimized using the Citrix Optimizer with the corresponding template.
It is expected to see a benefit in memory usage when enabling memory compression, as the same workload is simulated on the Citrix environment. Based on the theory, this means memory can be shared and therefore compressed. But as the compression is done by a separate dedicated process, there can be a penalty on CPU utilization. The primary bottleneck of the GO-EUC environment is CPU instead of memory. The expectancy is that there will be a positive effect on the total memory usage.
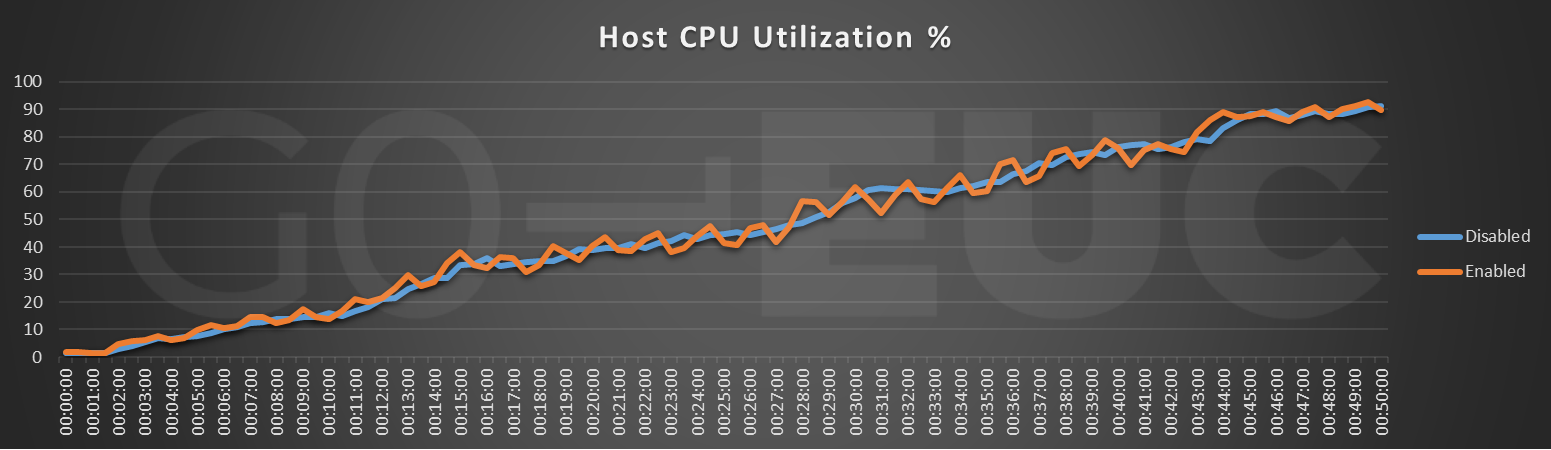
Because the CPU is the primary bottleneck, the first results to have a look at will be the CPU utilization of the hypervisor.
Lower is better
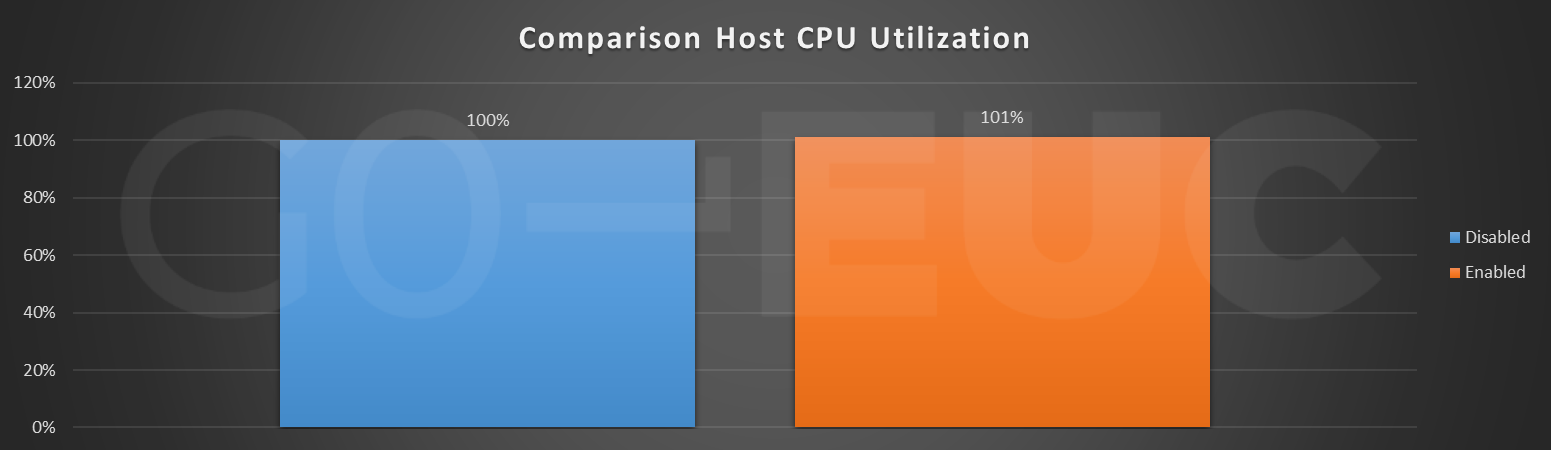
Lower is better
At first glance there is not any noticeable difference on the CPU utilization. However, the line chart does show a bit more fluctuation once memory compression is enabled. This might be caused by the additional process for memory compression.
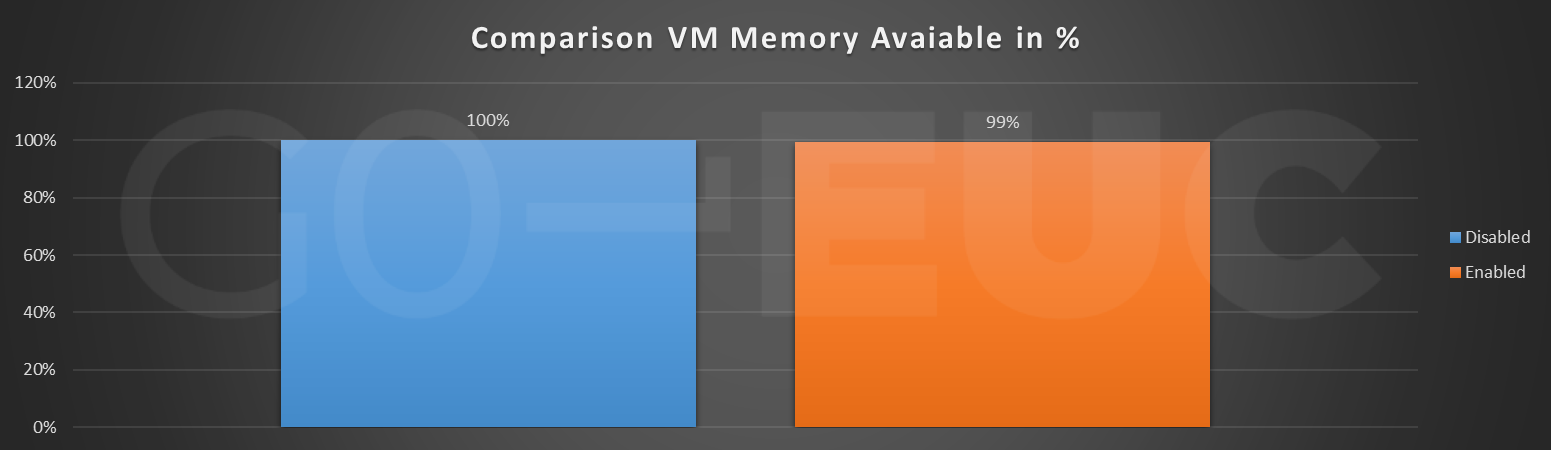
As there is no effect on the CPU utilization there might be a visible difference on memory. As multiple data sources are collected the memory usage from both hypervisor and VM will be shown.
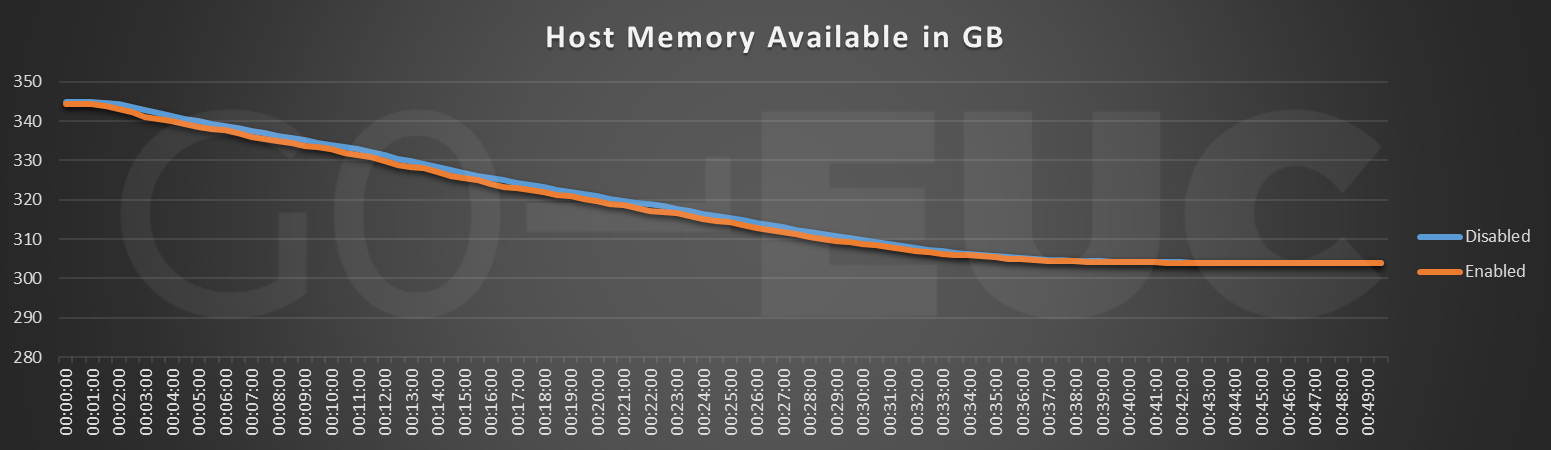
Lower is better

Lower is better
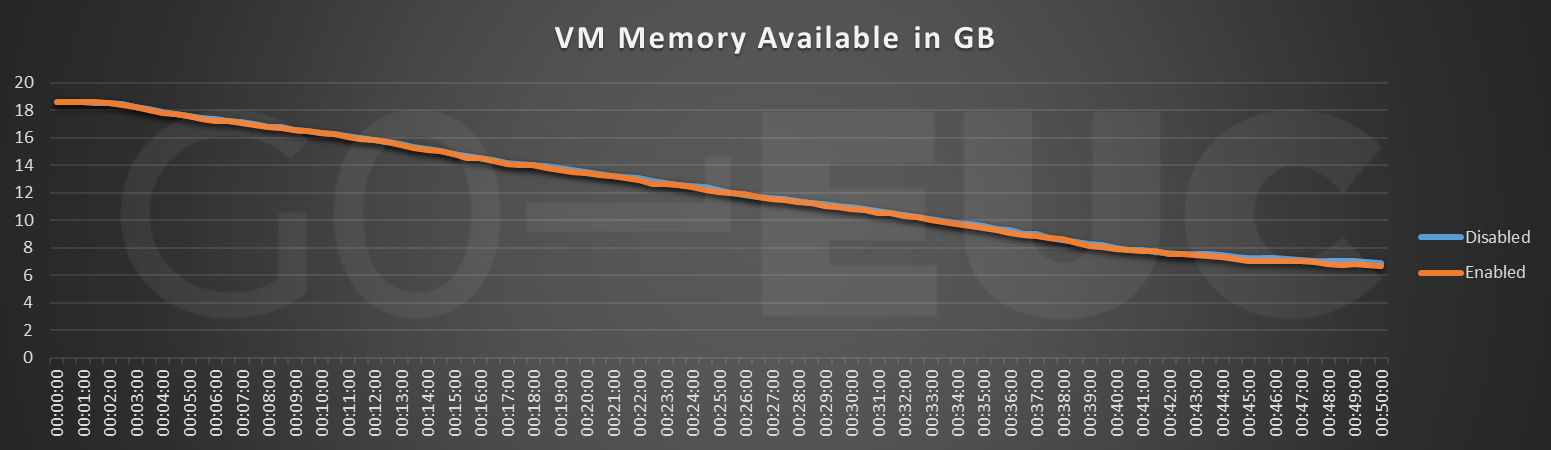
Lower is better
Lower is better
Memory shows almost no difference in memory consumption although compression is enabled. A difference of 0.64%, which is rounded 1%, is neglectable. It was expected to see at least a difference on memory. However, it does show the minimal difference at the end of the workload around 38 minutes, which might be an indication paging is taking place when memory compression is disabled.
In order to validate if paging is taking place the hypervisor storage metrics is a perfect metric to start with.
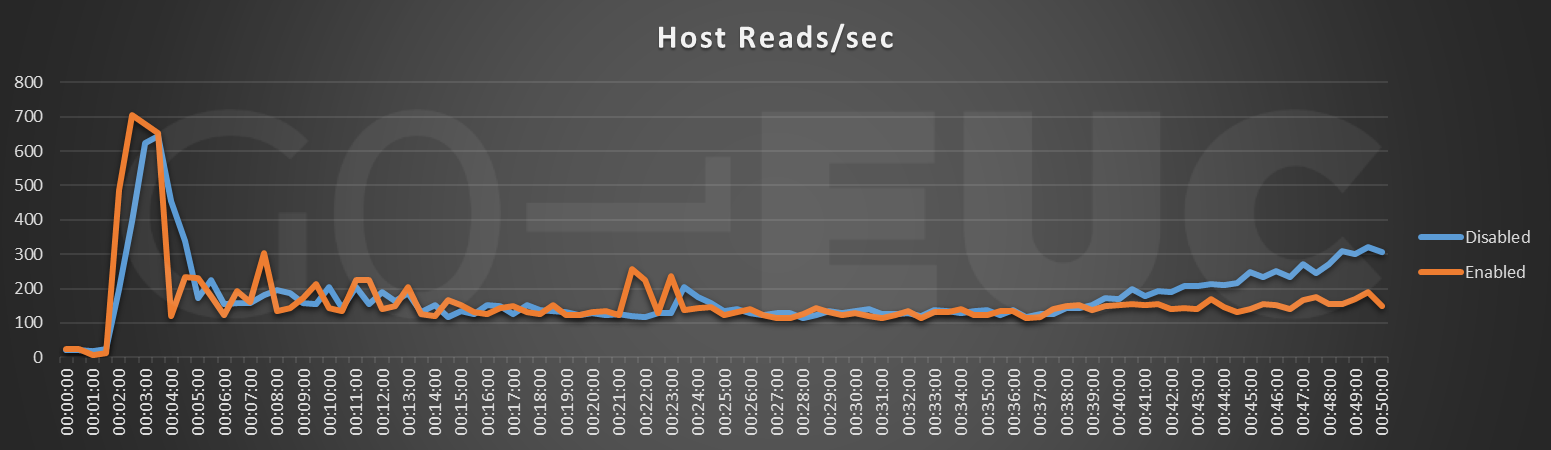
Lower is better
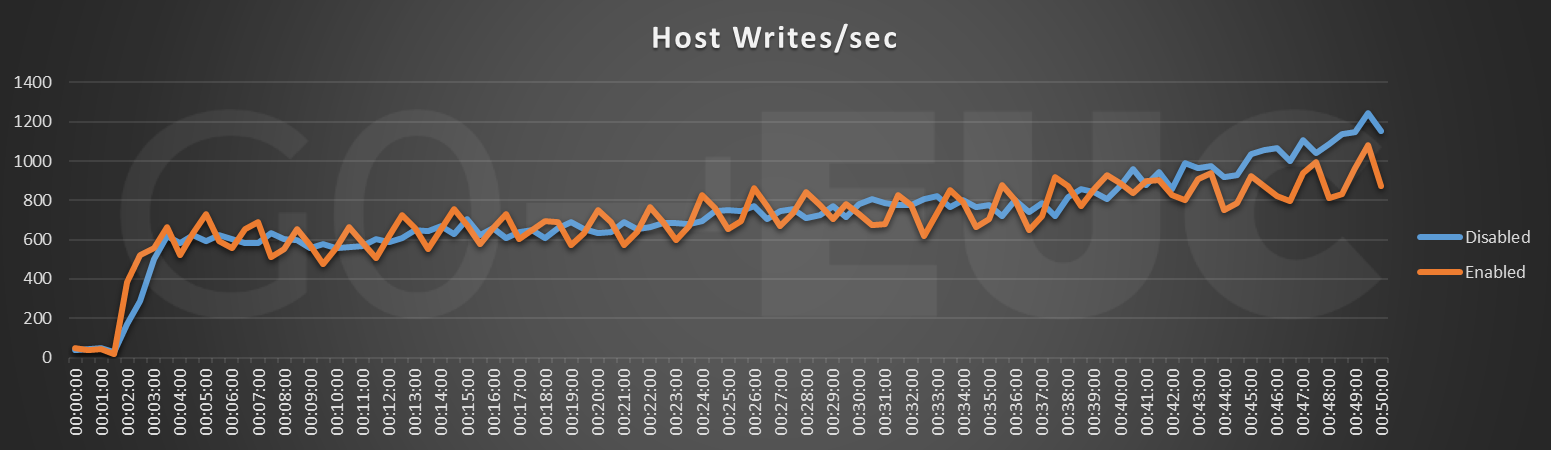
Lower is better
Lower is better
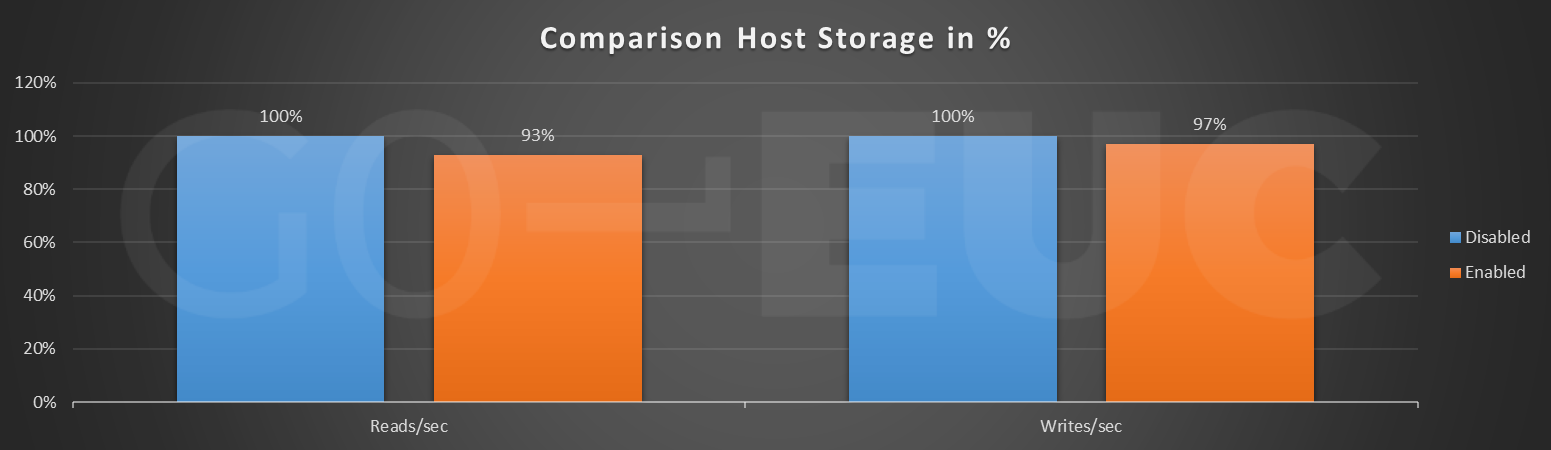
When enabling memory compression there is a difference in both reads/sec and writes/sec. It is hard to pinpoint the exact cause of this behavior, but this might due to the page file on the disk. As memory is compressed in the enabled scenario, the page file probably is not used and therefore results in a lower storage load.
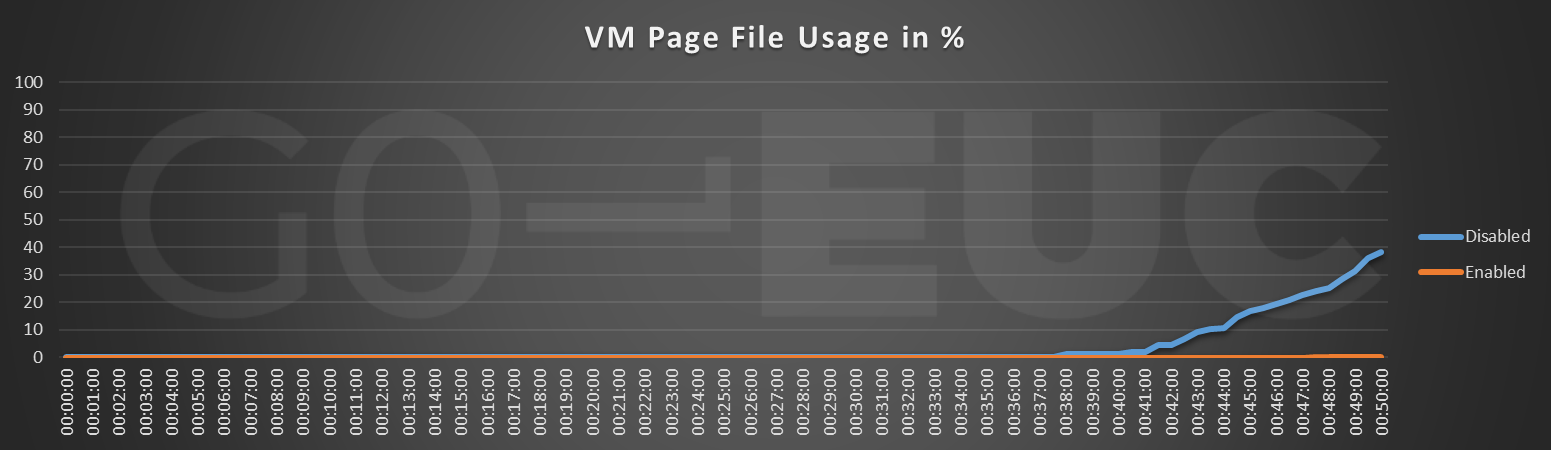
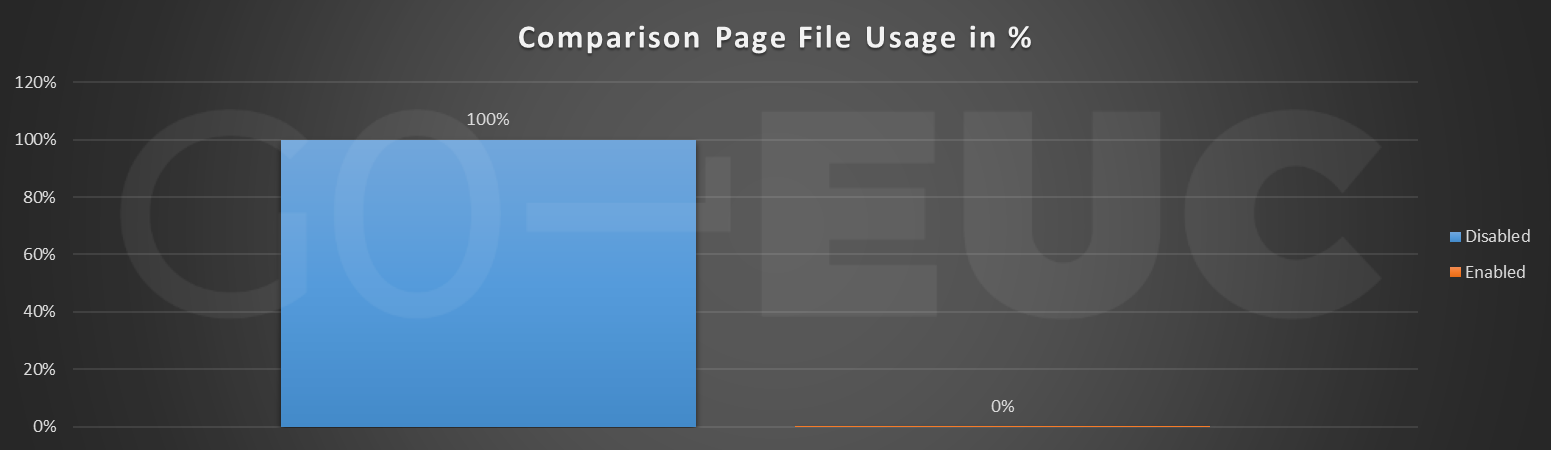
In order to prove this hypothesis, it is possible to leverage Performance Monitor to capture the page file usage. Page file usage is the amount of the “Page File instance in use in percent”.
Lower is better
Lower is better
The comparison shows huge difference in the page file usage. To provide context, the following table shows the absolute numbers of the comparison.
| Metric | Disabled | Enabled |
|---|---|---|
| Page File Usage | 3.4774 | 0.0013 |
The difference starts at the end of the test, at 38 minutes into the workload. Although memory is not fully utilized, paging does occur when memory compression is disabled. With memory compression no paging is taking place as the compression frees up memory. Although this was not clearly visible in the memory usage metrics, this does proof the benefit of memory compressions from a memory perspective.
This does explain the difference on the storage results, as paging is causing the additional IOPs.
For this research the page file is system managed. The results seem not to give a clear image of the true impact of memory compression as even in the enabled scenario, the page file is used at maximum of 0.03%.
Since the introduction of memory compression in Windows 10 1507 and Windows Server 2016, the operating system is able to store parts of the memory pages in a compressed form. When enabling memory compression, page combining is enabled automatically. Because there are no dedicated metrics for both memory compression and page combining in Windows Performance Monitor, all results are based on the combination of both features.
An important conclusion of this research is, when the environment is properly sized, memory compression is taking place but does not show any performance benefit. It might be different when the environment is undersized on memory.
It is noticed memory compression results in less paging that reduced the impact on storage. Although, as the environment of this research is properly sized, no CPU penalty for the memory compression is measured. At this point, it is not clear what the effect will be once memory compression is highly used.
There is no clear performance counter available showing the compressed memory results. It is expected memory compression is taking place right from the start but based on the results the difference is noticed when paging is taking place. This is around 60 percent memory usage in this specific research.
This research is primary focused on the scalability benefit of memory compression and does not take any improvement of session responsiveness into account. Based on the captured dataset it is not possible to determine any benefit and will require additional research.
Take for example the fact that when enabling memory compression, page combining is enabled as well. Does this only measure the effect of memory compression? No, it is a combination of both.
In theory, the effect of memory compression should be noticeable when memory is undersized but in order to proof this, another research is required. If you find this interesting, please let us know in the comments below, as the researches are scheduled based on community demand.
Note: There has been some reports that the memory compression causes blue screens, so before implementing in your environment, test! During testing, there were no blue screens in our environment.
What is your experience with memory compression? Please let us know in the comments or at the World of EUC Slack channel.
Photo by Michael Dziedzic on Unsplash

Malta